Surface Water Risk Located to the Garden, Not the Home
A buyer was told their prospective home was at high risk of surface water flooding. A site-specific assessment showed the risk was real, but it pooled in the rear garden, while the raised dwelling sat above it.
The Project
A private buyer was partway through purchasing a detached three-bedroom home in Berkshire when conveyancing searches flagged the site as being at risk of surface water flooding. The property sits within Flood Zone 1, so the risk from rivers and the sea was already understood to be low. The search instead pointed to surface water, or pluvial flooding, and the buyer had no way of knowing whether that meant the house itself was exposed.
The concern was not abstract. A surface water flag can unsettle mortgage approval, push up insurance premiums and raise questions over future resale value. Rather than withdraw from a property they wanted, or proceed without understanding the risk, the buyer instructed Unda to carry out a site-specific flood risk survey for the purchase and establish how much of the flagged risk actually reached the building.
The Challenge
The Environment Agency’s surface water mapping showed the plot spanning a “Low” to “High” chance of flooding, both at present day and under future climate change scenarios. On the face of it, that is the kind of result that gives a lender or insurer pause.
The difficulty was that the mapping could not tell the buyer where on the plot that risk fell. National-scale datasets model risk across the whole country at once; they do not assess conditions at an individual property. Local topography, the height of the building’s thresholds and any private drainage on the plot are not taken into account. As we explain in our guide to Flood Zones 1, 2 and 3, a Flood Zone 1 designation only addresses rivers and the sea, so surface water has to be assessed separately and at a finer grain.
That left a real gap. The search implied the house could take on water internally, with everything that follows for mortgage lending and insurability. Without a closer look, the buyer risked making a significant financial decision on the strength of broad strategic mapping rather than the actual behaviour of water at the property.
What We Did
We carried out a detailed site-specific assessment, combining Environment Agency mapping, LiDAR elevation data, historic flood records and a site visit and walkover.
The records were reassuring on most fronts. The property lies in Flood Zone 1, and there were no historic records of fluvial, groundwater, sewer or reservoir flooding at the site. Thames Water confirmed no incidents of sewer surcharge, and the EA held no historic flood records for the area.
The surface water picture was more nuanced, and it is where the assessment earned its value. Reading the mapping against the LiDAR data and what we saw on site, the highest predicted depths were concentrated in the rear garden, which forms a shallow bowl. Surface water flowing off higher ground to the south, east and west collects in this low point rather than draining away to the culverted watercourse to the north-west. The patio and the far end of the garden sit visibly higher than the central lawn, where the water is predicted to pond.
Crucially, that ponding zone is separated from the house by a series of steps up in level. The dwelling sits roughly 360mm above the patio, which itself sits roughly 360mm above the garden. Door thresholds range from about 100mm at the front entrance to around 520mm at the garage, and electrical sockets, meters and services were generally set well above ground level. Existing drains, downpipes and Aco channels were managing runoff, though some drains were partly blocked by leaf litter and would benefit from routine clearing.
We were also clear about the limits of the modelling: national surface water mapping applies a standard drainage rate across all hard surfaces and does not credit individual gullies or privately owned drainage. By setting the modelled outputs against measured site levels, we could give a proportionate reading of how the risk actually applied to the building. The dwelling itself fell within “Low” risk at present day, shifting to “Medium” with climate change, while the genuine “High” risk stayed in the garden.
The Outcome
The assessment gave the buyer a clear, evidence-based understanding of the risk in place of a worrying but unspecific search result. The dwelling’s raised thresholds meant the building was at low risk of internal flooding, with the surface water concentrated in the rear garden.
The buyer valued the findings enough to ask for a follow-up meeting to talk through what they had learned and the property-level resilience measures they could add if they went ahead. By clarifying a broad mapping flag early in the process, the assessment helped avoid an unnecessary delay or withdrawal, and gave the buyer evidence they could put to a lender or insurer.
This project shows how a proportionate, site-specific assessment can locate surface water risk precisely, telling apart a property that is genuinely exposed from one where the water has somewhere else to go.
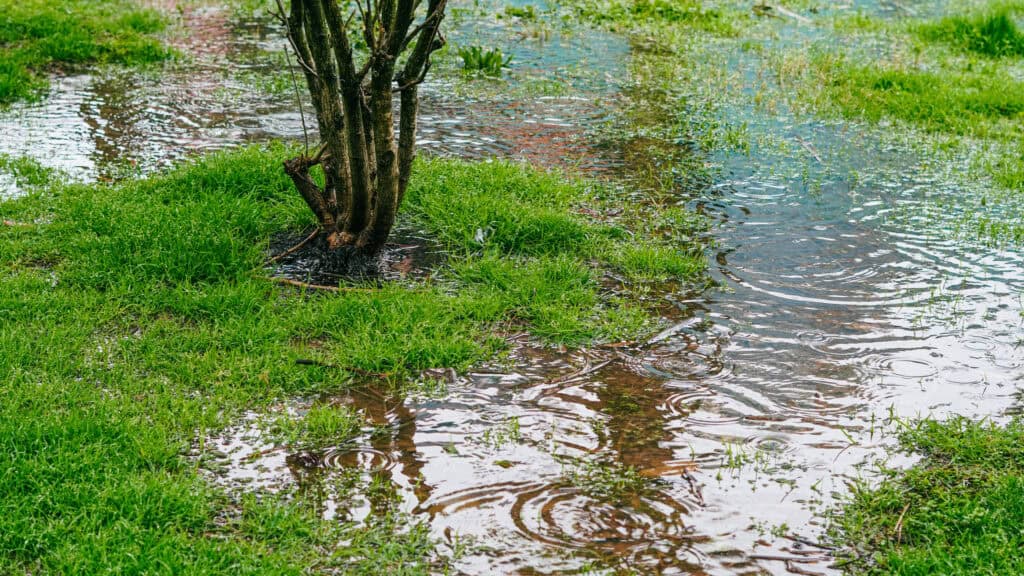 Heavy rain collects on low-lying grass like this, which is where surface water tends to pond in a garden rather than against the house.
 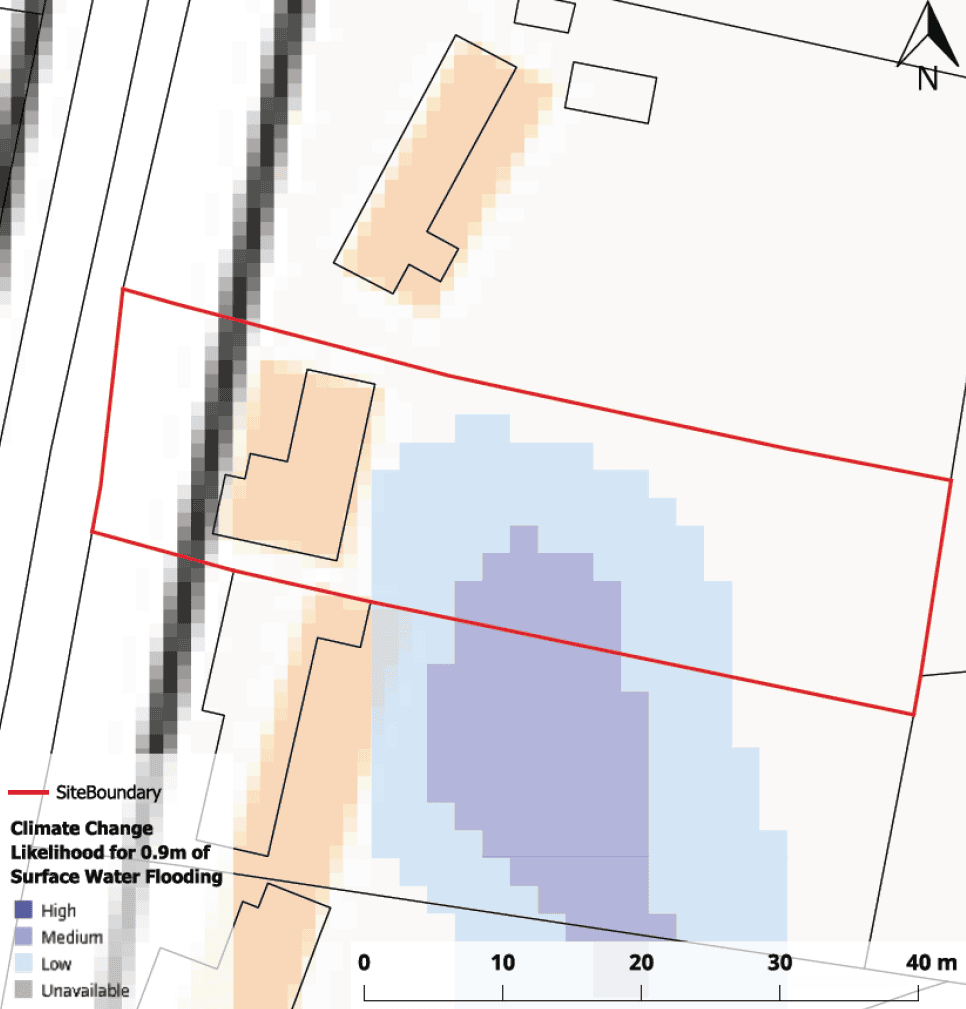 Under the climate change scenario, the deeper surface water risk still collects in the bowl-shaped rear garden, set back from the dwelling.