Flood Zones Explained: Zone 1, 2 and 3 (England)
Estimated reading time 16 minutes
Flood zones are how the planning system in England describes the chance of a site flooding from rivers or the sea. They sort land into Flood Zone 1, 2 or 3 (with Zone 3 split into 3a and 3b), from lowest to highest probability, and they largely decide how flood risk is judged on a planning application. This guide explains what each flood zone means, how the boundaries are drawn, and how the position shifted when the Environment Agency rebuilt its national mapping in 2025 and the National Planning Policy Framework was rewritten in August 2026.
Flood zones describe the probability of flooding from rivers and the sea. They are not a prediction that a site will flood, and they are not the whole flood risk picture.
They are shown on the Environment Agency's Flood Map for Planning, which is usually the first check anyone makes when assessing a development site. Since 25 March 2025 those zones have been produced as part of the second National Flood Risk Assessment (NaFRA2), so the map you look at today is not the map that existed when many older reports were written. And since 17 August 2026 the definitions behind them sit inside the National Planning Policy Framework itself, in a new Annex F, rather than in separate guidance. This article covers England only; Wales works to a separate framework under TAN15, with different mapping and different tests.
What are flood zones, and what do they actually tell you?
A flood zone is a classification of land by its annual probability of flooding from rivers or the sea, based on statistical modelling rather than a record of past floods. The zones are set nationally and used by planning authorities, developers, architects and property owners to gauge the level of river or coastal flood risk affecting a site.
Two things about flood zones are widely misread, so they are worth stating plainly. First, a zone is a measure of likelihood, not certainty: land in a higher zone has a greater statistical chance of flooding, not a guarantee of it. Second, the zones only account for flooding from rivers and the sea. They say nothing about surface water, groundwater or drainage, which have to be assessed separately.
- Probability, not history: zones are modelled from statistical chance, so a site can sit in a high zone having never flooded, and a low-zone site is not risk-free.
- Rivers and sea only: surface water, groundwater and sewer flooding fall outside the flood zone definition and are mapped separately.
- A starting point, not the answer: the national map is read alongside the local Strategic Flood Risk Assessment (SFRA) and any site-specific evidence.
- Present day by default: the standard zones show current risk; future risk from climate change is shown on separate layers and assessed separately.
Because the Flood Map for Planning is a national dataset, planning decisions never rest on it alone. It tells you which zone a site falls in; it does not tell you the flood level at the site, how deep water might get, or how risk changes over the lifetime of a development. For those questions you need the local SFRA and, on most sites in Zones 2 and 3, a site-specific flood risk assessment. If a term on this page is unfamiliar, our flood risk and drainage glossary defines it as we use it in practice.
England's flood zones at a glance
There are three flood zones, with the highest-risk zone divided in two. Flood Zone 1 is low probability, Flood Zone 2 is medium, and Flood Zone 3 is high, subdivided into Zone 3a (high probability) and Zone 3b (the functional floodplain). Annex F, Table 1 of the NPPF now sets out these definitions inside the Framework for the first time; before August 2026 they lived only in Planning Practice Guidance. The table below sets them side by side; the sections that follow take each one in turn.
| Flood zone | Annual probability (rivers / sea) | What it means |
|---|---|---|
| Flood Zone 1 — low | Less than 0.1% (below 1 in 1,000) | Lowest risk. Most development is directed here. |
| Flood Zone 2 — medium | 0.1%–1% rivers / 0.1%–0.5% sea | Development is often possible, subject to the vulnerability of the use. |
| Flood Zone 3a — high | 1%+ rivers / 0.5%+ sea | Some development possible where the planning tests are met. |
| Flood Zone 3b — functional floodplain | Land that floods or stores water in a flood (typically 3.3%+, or 1 in 30) | Development heavily restricted; defined locally through the SFRA. |
Flood Zone 1 – low probability
Flood Zone 1 is land with less than a 0.1% annual probability of flooding from rivers or the sea, a chance of less than 1 in 1,000 in any given year. It is the lowest flood risk category, and national policy steers most development towards it. The great majority of England sits in Flood Zone 1.

Low probability does not mean no risk. Because flood zones only measure river and coastal flooding, a Flood Zone 1 site can still flood from surface water, groundwater or an overwhelmed drainage system.
This matters more than it used to. The August 2026 Framework widened the point at which a Flood Zone 1 site needs a flood risk assessment: under policy F4, any land shown at risk from any source, now or in the future, on the Flood Map for Planning or in the local SFRA now needs an assessment, along with sites of one hectare or more and sites in an Environment Agency critical drainage area. The old qualifier that the risk had to involve a "more vulnerable use" has gone. A site in Zone 1 shown at risk of surface water flooding can also be drawn into the Sequential Test, though where surface water is the only source a site-specific assessment can now remove that test under policy F5. Zone 1 is the starting point for low risk, not a guarantee of a clear run through planning.
Flood Zone 2 – medium probability
Flood Zone 2 is land with a medium probability of flooding: between 0.1% and 1% annual probability from rivers, or between 0.1% and 0.5% from the sea. In plain terms, that is roughly a 1 in 100 to 1 in 1,000 yearly chance from rivers, or 1 in 200 to 1 in 1,000 from the sea.
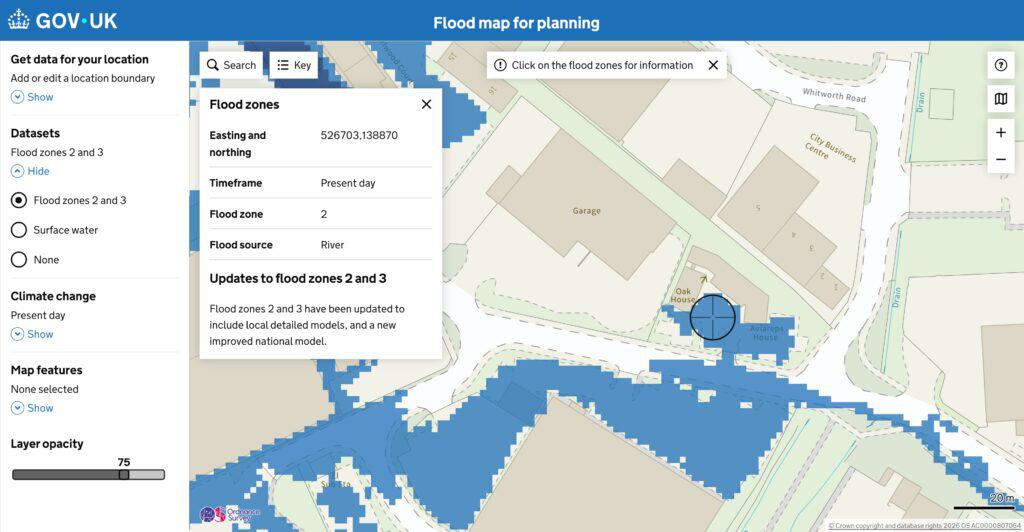
Development is often still acceptable in Flood Zone 2, but the planning authority weighs the type of development proposed, and that judgement turns on how vulnerable the use is to flooding.
- Vulnerability drives the outcome: uses are graded by their flood risk vulnerability classification, now set out in Annex F, Table 2 of the NPPF, from water-compatible through to highly vulnerable. Our guide to the flood risk vulnerability classification works through the categories.
- The Exception Test can apply: highly vulnerable development in Flood Zone 2 has to pass the Exception Test (policy F6) as well as the Sequential Test.
- An assessment is usually expected: most development in Flood Zone 2 needs a site-specific flood risk assessment to support the application.
Flood Zone 3 – high probability
Flood Zone 3 is land with the highest probability of flooding from rivers or the sea: a 1% or greater annual chance from rivers (1 in 100 or more), or a 0.5% or greater annual chance from the sea (1 in 200 or more). Within the planning system it is divided into two parts, Zone 3a and Zone 3b, which carry very different consequences.

Flood Zone 3a – high probability
Zone 3a is land at high probability of flooding where some development may still be appropriate, depending on the use proposed and whether the planning tests are satisfied. Development here almost always needs a flood risk assessment and, in most cases, the Sequential Test, plus the Exception Test where a more vulnerable use is proposed.
Flood Zone 3b – the functional floodplain
Zone 3b is the functional floodplain: land where water has to flow or be stored during a flood. Because that storage and conveyance role protects other land, development in Zone 3b is heavily restricted. Annex F, Table 3 of the NPPF now states this outright, with most uses to be refused and only water-compatible uses and certain essential infrastructure, where it passes the Exception Test, treated as compatible with it.
Zone 3b is not read straight off the national map. It is defined locally through the authority's SFRA, usually in consultation with the Environment Agency, at a present-day 3.3% annual probability (1 in 30) flood extent that includes the effect of defences, together with mapped water storage areas. Annex F now gives that 1 in 30 definition national policy status. One consequence worth noting: the classification that decides what counts as essential infrastructure was widened in August 2026 to bring in data centres, electric-vehicle charging and several energy uses, which changes how those uses are treated on the highest-risk land.
Why flood zones matter in planning
Flood zones matter because they set the policy hurdles a development has to clear. National planning policy applies a risk-based, sequential approach: steer development to the lowest-risk land first, and only allow higher-risk sites where there is good reason and the risk can be managed safely. The zone a site falls in, combined with how vulnerable the proposed use is, determines which tests and reports the application needs.
| Flood zone | Annual probability (rivers / sea) | Risk level | Typical planning requirement |
|---|---|---|---|
| Zone 1 | Less than 0.1% | Low | No zone-based test; a flood risk assessment where a policy F4 trigger applies (1 hectare or more, a critical drainage area, or land shown at risk from any source) |
| Zone 2 | 0.1%–1% / 0.1%–0.5% | Medium | Site-specific assessment; Sequential Test; Exception Test for highly vulnerable uses |
| Zone 3a | 1%+ / 0.5%+ | High | Assessment; Sequential Test; Exception Test for more vulnerable uses |
| Zone 3b | Functional floodplain | Highest | Development heavily restricted; only water-compatible or essential infrastructure (Exception Test) |
The three mechanisms that flow from the zones are the Sequential and Exception Tests and the site-specific flood risk assessment. The framework that ties them together is the National Planning Policy Framework and its supporting Planning Practice Guidance on flood risk and coastal change, which the government keeps online as official guidance. Since the August 2026 rewrite, those flood rules sit in a dedicated chapter, policies F1 to F9, and the safety and exception tests are worded so that non-compliant schemes should be refused. Getting the zone wrong, or misjudging the tests it triggers, is one of the more common reasons a scheme stalls.
Not sure what your site's flood zone means for planning?
Send us the site and we'll tell you which tests and reports it needs. Most quotes come back within one working day.
Start a QuoteHow to check which flood zone a site is in
You can check a site's flood zone in a few minutes using the Environment Agency's Flood Map for Planning, but a planning-grade answer takes a little more. The national map gives the headline zone; the local SFRA and site-specific evidence give the detail a planning authority will actually rely on.
- Search the Flood Map for Planning. Enter the site address or grid reference on the Environment Agency's Flood Map for Planning to see the flood zone, the "Flood Zones plus climate change" layer and the surface water layers. Our guide to the Flood Map for Planning explains what each layer shows, and you can screen a site quickly on our flood risk map postcode checker.
- Read it alongside the local SFRA. The authority's Strategic Flood Risk Assessment refines the picture locally and is where Zone 3b is defined. The national map does not fix the functional floodplain on its own.
- Check all sources, not just the zone. Look at the surface water layers and any groundwater or drainage history; a low river-and-sea zone can still carry real risk from other sources.
- Confirm the data is current. The mapping has changed repeatedly since 2025, so a zone quoted in an older report should be re-checked against the live Flood Map for Planning before you rely on it.
How flood zones are mapped, and what NaFRA2 changed
Flood zones are modelled nationally by the Environment Agency from hydraulic modelling, terrain data and recorded flood outlines, then published through the Flood Map for Planning. The big shift is recent: from 25 March 2025 the zones are produced as part of the second National Flood Risk Assessment, NaFRA2, which blends national modelling with local models and updates the picture for many sites.
From 25 March 2025, the Flood Zones are produced as part of the new National Flood Risk Assessment (NaFRA2). This uses new national modelling alongside local models.
Environment Agency, Flood Map for Planning – Flood Zones dataset
For planning, three practical consequences follow from the NaFRA2 rebuild. Some watercourses that were previously unmapped, smaller catchments the old modelling did not reach, now generate flood zones, so land that read as Zone 1 can appear in Zone 2 or 3. The functional floodplain is better supported, through the present-day 1 in 30 defended extent noted above. And the Environment Agency flood data behind a site can simply have moved, which is why an assessment has to appraise the age and suitability of the datasets it uses. Where a site sits close to a boundary or needs a level the national map cannot give, hydraulic modelling is often the way to pin it down.
A flood zone quoted from a report written before 2025 may no longer match the live map. The national mapping has been rebuilt and updated several times since, so an old zone should never be taken on trust.
Flood zones and climate change
The standard flood zones show present-day risk and do not, by themselves, account for climate change. To fill that gap the Environment Agency publishes separate "Flood Zones plus climate change" layers, which show how the flooded area could grow over the lifetime of a development. A site outside Zones 2 and 3 today can still be flagged for future risk, particularly near rivers, coasts and low-lying ground.

The map has kept moving on this front. On 28 May 2026 the Environment Agency added surface-water climate-change extents and banded depth layers to the Flood Map for Planning, and withdrew the older "Check your long term flood risk" surface-water data from development use. Those climate change extents are modelled on the upper-end allowance for the 2070s, so they are deliberately cautious about how far risk could spread.
- Two things to check, not one: read the present-day zone and the "Flood Zones plus climate change" layer together, because future risk can change the answer.
- Surface water now carries a climate view: the May 2026 update means surface water is mapped with a climate change allowance and weighs in the Sequential Test.
- Detail comes from the assessments: the precise climate change allowances are applied through the SFRA and the site-specific assessment, not read off the national map.
Common misunderstandings about flood zones
Flood zones are routinely misread, especially by people meeting flood mapping for the first time during a purchase or a planning application. Four misconceptions come up again and again.
- "Flood Zone 3 means a property floods regularly." The zone is a statistical probability, not a flood diary. Many Zone 3 sites have never flooded in living memory, which is also why a map can look wrong.
- "Flood Zone 1 means there is no flood risk." Zone 1 only covers rivers and the sea. Surface water, groundwater and drainage can still cause flooding there.
- "If defences are built, the zone should change." Flood zones generally show undefended, natural risk, so a property can stay in a flood zone even after new defences are built.
- "My home has never flooded, so it shouldn't be zoned." Zones are based on modelling and probability, which is why a house can sit in a flood zone despite never having flooded.
Frequently asked questions about flood zones
Can a site's flood zone change over time?
Yes. The national mapping is periodically remodelled, most recently through NaFRA2 from March 2025, and a site can move between zones as the modelling, terrain data or defences behind it are updated. Where the mapping looks wrong for a specific site, better site-specific evidence, such as topographic survey and hydraulic modelling, can be used to challenge the designation. It is always worth confirming the zone against the live Flood Map for Planning rather than an older report.
Did the August 2026 NPPF change the flood zone definitions?
The definitions themselves are unchanged in substance, but they now sit inside the National Planning Policy Framework, in Annex F, rather than in separate guidance. What changed is the policy around them: wider triggers for a flood risk assessment in Zone 1, a surface-water-only exemption from the Sequential Test, and refusal-worded tests. Our explainer on the August 2026 NPPF changes and our NPPF flood risk guidance cover the detail.
What is the difference between the Flood Map for Planning and the "check long term flood risk" service?
They are different tools for different jobs. The Flood Map for Planning is the dataset used to assess planning applications and to determine flood zones. The public "check long term flood risk" service is aimed at homeowners and gives a broader, property-level view. They can show different things for the same address, which is why the right one matters for a planning question.
Can flood zones affect a mortgage or insurance?
They can influence both, but neither lender nor insurer relies on the planning flood zone alone. Insurers price on their own flood models and claims history, and most UK household flood cover is supported through the Flood Re scheme. A higher flood zone can prompt closer scrutiny, but a site-specific assessment often gives a more accurate, and sometimes more favourable, picture than a headline zone.
Does Wales use the same flood zones as England?
No. Wales runs a separate system under TAN15 and Planning Policy Wales, with its own flood maps and zones and a Flood Consequence Assessment in place of the English flood risk assessment. The Annex F definitions in this article apply to England only.
Flood zones are only the starting point
Flood zones give a fast, national read on river and coastal flood risk, and they decide which policy tests a development faces. But they are the opening question, not the final answer. A sound flood risk case pulls in the surface water and climate change layers, the local SFRA, the vulnerability of the proposed use and, on most Zone 2 and 3 sites, a site-specific flood risk assessment that establishes the actual flood level and shows how the scheme stays safe over its lifetime.
If you need to understand a site's flood zone, or turn it into a planning-ready report, Unda's flood risk consultants advise on flood zones, mapping, the Sequential and Exception Tests and flood risk assessments for planning across England. Send us the site and we will tell you where you stand.
Latest news

One of our experienced Flood Risk Consultants will get back to you within 60 minutes
