Flood Map for Planning: What It Shows and How to Use It
Estimated reading time 14 minutes
The Flood Map for Planning is the Environment Agency's official online map of flood risk from rivers and the sea across England, used in the planning system to decide whether flooding needs to be assessed for a site. It is a screening tool that shows where flood risk may apply, not a prediction that a particular property will flood.
Local planning authorities, developers, architects and property owners all reach for the same map at the start of a project. It gives everyone a consistent national picture, governed by the National Planning Policy Framework (NPPF), of where a site-specific Flood Risk Assessment is likely to be needed before a decision can be made.
The map defines the Flood Zones that drive planning policy, but it stops at screening — a site in a mapped zone still needs its own assessment to show what the risk actually means on the ground.
This guide explains what the map shows, how to read each layer, how it feeds into a planning application, how it changed across 2025 and 2026, and where it stops being reliable. It also covers what the August 2026 rewrite of the NPPF changed about how the map is used. You can open the map yourself on the GOV.UK Flood Map for Planning service.
Who produces the Flood Map for Planning?
The map is produced and maintained by the Environment Agency, which builds the national flood risk datasets used across England's planning system. Natural Resources Wales runs the equivalent service for Wales.
The underlying data comes from hydraulic modelling, topographic survey and flood risk analysis, estimating where flooding from rivers or the sea would reach under different probabilities. It is rebuilt and republished as modelling improves and new evidence arrives, which is why the version on screen today is not the version that was there two years ago.
Because the mapping is modelled rather than drawn from past floods, a property can sit inside a mapped zone even if nobody living there remembers water.
How the Flood Map for Planning works
The service is an interactive online viewer. You search by postcode, place name or grid reference, and switch between the two main sources of flooding it holds: flooding from rivers and the sea, and surface water flooding. Only one source shows at a time, so each type of risk is read on its own.
- Flooding from rivers and the sea: the dataset that underpins the planning Flood Zones and carries the most weight in a planning decision.
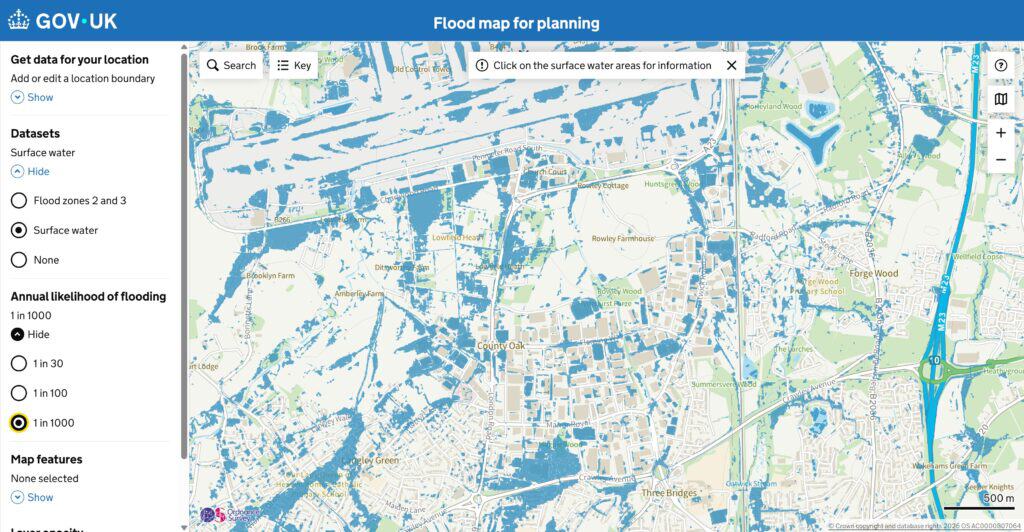
- Surface water flooding: shown separately, this is water from intense rainfall overwhelming drains and running across the ground, and it drives drainage design and the Sequential Test rather than the Flood Zones.
The distinction matters because the two behave differently and are managed by different bodies. A site can sit in Flood Zone 1 for rivers and sea yet still fall inside a mapped surface water flow path, as covered in our guide to the sources of flood risk.
How to read the Flood Zones
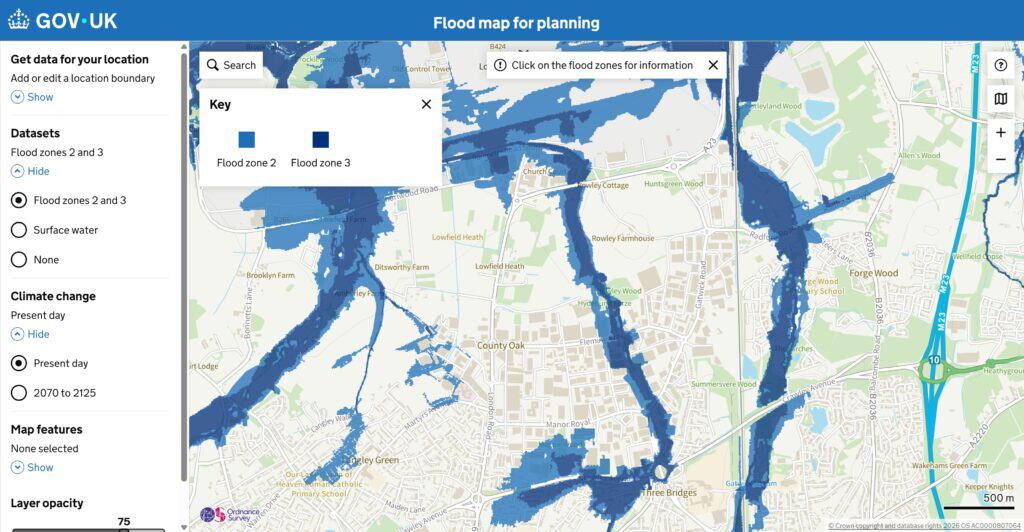
The Flood Zones are the heart of the map for planning. They band land by the annual probability of flooding from rivers and the sea, from Flood Zone 1 (low) to Flood Zone 3 (high), with Flood Zone 3b marking the functional floodplain where water flows or is stored. Crucially, the zones show the undefended floodplain — they ignore the protection that walls and embankments provide, which is why defended land can still map as Zone 3.
| Flood Zone | Annual probability (rivers and sea) | What it means for planning |
|---|---|---|
| Zone 1 — Low | Less than 0.1% (below 1 in 1,000) | Lowest risk. An assessment is only needed for larger sites or where another source or future risk is flagged. |
| Zone 2 — Medium | 0.1% to 1% (1 in 1,000 to 1 in 100) from rivers; 0.1% to 0.5% (to 1 in 200) from the sea | A Flood Risk Assessment is required and the Sequential Test applies. |
| Zone 3a — High | 1% (1 in 100) or greater from rivers; 0.5% (1 in 200) or greater from the sea | A Flood Risk Assessment is required; higher-risk uses also face the Exception Test. |
| Zone 3b — Functional floodplain | Land where flood water flows or is stored, usually a 3.3% (1 in 30) or greater chance; defined locally in the SFRA | Most development is steered away; only water-compatible and essential infrastructure is likely to be appropriate. |
Until recently these thresholds sat only in the Government's Planning Practice Guidance. Since 17 August 2026 they are written into the NPPF itself, at Annex F, Table 1. That is the first time national planning policy has defined the Flood Zones directly, including the split between Flood Zone 3a and the functional floodplain, and the 3.3% annual chance that usually marks Flood Zone 3b. The zone a site falls in still determines whether the Sequential Test applies and whether a Flood Risk Assessment is required, so it is usually the first thing a planner checks. Our Flood Zones explained guide works through each band in more detail.
Climate change scenarios in the Flood Map for Planning
For flooding from rivers and the sea, the viewer lets you switch between present-day risk and a future climate change scenario. The future layer shows how the extent could grow over the lifetime of development, and the scenario currently displayed represents projected flood risk for the period between 2070 and 2125.
Climate change modelling in the rivers-and-sea view applies to that source only. It gives planners a sense of how a site's Flood Zone could change as sea levels rise and rainfall intensifies, which feeds directly into the climate change allowances an assessment has to apply.

A site that sits in Flood Zone 1 today can move into a higher zone under the climate change layer, which is exactly the kind of future risk a planning application has to design for.
What the supporting layers show
Alongside the flood risk datasets, the viewer can display context layers that help explain how water moves through the landscape. They do not carry a probability of their own; they tell you why the risk sits where it does.
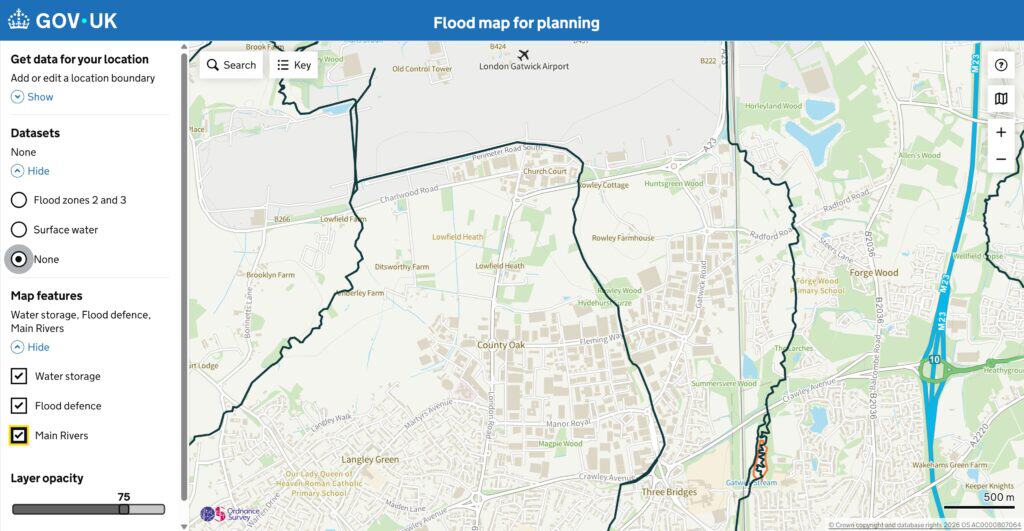
- Flood defences: the location of embankments, walls and other flood defence structures that reduce risk to land behind them.
- Main rivers: the main rivers the Environment Agency regulates, as opposed to ordinary watercourses managed by others.
- Water storage areas: places designed to hold flood water back, such as washlands and storage reservoirs.
The defence layer explains one of the most common questions we field: a property can sit behind a substantial flood wall and still appear in Flood Zone 3, because the zones map the natural floodplain rather than the defended one. We unpack that in our note on why land stays in a flood zone after new defences are built.
How the map is used in a planning application
In the planning system the map is the starting point, not the finish line. It tells a planner or consultant whether flood risk is a live issue for a site, and if it is, what further evidence a decision-maker will expect. The route from map to decision usually runs like this.
- Check the Flood Zone. Screen the site on the map for flooding from rivers and the sea, and note the surface water position separately.
- Apply the Sequential Test where needed. For sites in Flood Zone 2 or 3, or affected by surface water, steer development to lower-risk land first. Under the August 2026 NPPF this test sits in Policy F5, which for the first time makes the Flood Map for Planning, alongside the Strategic Flood Risk Assessment, the formal evidence base for the test. That builds on the September 2025 Planning Practice Guidance update, and adds a narrow exemption for sites at risk from surface water only.
- Prepare a Flood Risk Assessment. Where the site is at risk, a site-specific Flood Risk Assessment, now required by Policy F4, sets out the real risk and how the scheme stays safe without increasing risk elsewhere.
- Address vulnerability and, if required, the Exception Test. Match the land use to the zone using the flood risk vulnerability classification, now set out in the NPPF at Annex F, Table 2, and run the Exception Test where Annex F, Table 3 requires it.
Get this sequence wrong and an application can be invalidated or refused before it is properly considered. The map is where that sequence begins, but the judgement about whether a site is safe belongs to the assessment, not the screening map.
How the Flood Map for Planning has changed in 2025 and 2026
The Flood Map for Planning has been through the most significant period of change in its history, with three major refreshes in just over a year. If you last looked at the map in 2024, several things on it now mean something different, so it is worth knowing which layer you are reading and how current it is.
- March 2025 — NaFRA2 launch. New national modelling, smaller watercourses added, and a 1-in-30 defended extent to help define Flood Zone 3b. See our note on the NaFRA2 modelling.
- August 2025 — Flood Zones plus climate change. Future rivers-and-sea Flood Zones with a climate change allowance added to the viewer, covered in our August 2025 update.
- 28 May 2026 — surface water climate change and depths. Upper-end 2070s surface water extents and seven depth bands added; the old long term flood risk surface water data retired for planning. Our May 2026 surface water update breaks down what it means for a Flood Risk Assessment, SuDS design and the Sequential Test.
- Later in 2026 — rivers and sea depths. Banded depth data for rivers and the sea is due to follow on the Defra Data Services Platform.
Alongside these changes to the mapping, the August 2026 rewrite of the NPPF changed how the zones are used, not what they show. The Flood Zone definitions moved into the Framework itself, and the trigger for a Flood Risk Assessment was tied more directly to what the map displays. The picture on screen is the same. The policy weight behind it is heavier.
What the Flood Map for Planning cannot tell you
The map is a national screening tool built at strategic scale, and reading it as a property-level forecast is the single most common mistake. It answers "could flooding be an issue here?", not "what will happen at this address in the next big storm?". Several limits follow from that.
- It is not property-specific: the modelling works at area scale, so it can flag a site as at risk when the building itself sits above the flood level, and occasionally the reverse. Our piece on whether flood maps are accurate works through why.
- The Flood Zones ignore defences: they show the undefended floodplain, so defended land still maps as higher risk than it is in practice.
- It is modelled, not historic: a site can be mapped at risk with no record of flooding, which is why homes appear in zones despite never having flooded.
- It does not map every source: groundwater and sewer flooding are not shown and have to be assessed separately in a Flood Risk Assessment.
One further trap is confusing this map with the public Check Your Long Term Flood Risk service. They look similar and share a publisher, but only the Flood Map for Planning carries weight in a planning decision, and since May 2026 the long term service's surface water data cannot be used for development planning at all.
When you still need a Flood Risk Assessment
Where a site is affected by flooding, the map hands over to a site-specific Flood Risk Assessment. The map screens; the assessment does the technical work of comparing modelled flood levels to site levels, testing the effect of defences, and showing that development is safe and does not increase risk elsewhere. The Planning Practice Guidance is explicit that the two do different jobs.
Flood risk is a combination of the probability and the potential consequences of flooding.
GOV.UK Planning Practice Guidance, Flood risk and coastal change
A Flood Risk Assessment is required for all development in Flood Zones 2, 3a and 3b, and for sites of one hectare or more in Flood Zone 1. Under Policy F4 of the August 2026 NPPF, the list of smaller Flood Zone 1 sites that need one has widened. An assessment is now expected wherever the Strategic Flood Risk Assessment or the Flood Map for Planning shows the land at risk from any source, now or in the future. The map is named in the Framework's own footnote as the trigger, which ties the assessment requirement directly to what the map displays, including the surface water and climate change layers. If you are not sure whether your site crosses that line, our guide on when you need a Flood Risk Assessment sets out the triggers.
If you need help interpreting the Flood Map for Planning, preparing a Flood Risk Assessment, or navigating a planning application on a site affected by flooding, Unda's flood risk consultants can help. You can also look up any term in our flood risk and drainage glossary.
Not sure what the map means for your site?
Get a free, no-obligation quote. One of our experienced flood risk consultants will get back to you within 60 minutes.
Start a QuoteFrequently asked questions
Is the Flood Map for Planning the same as the long term flood risk map?
No. The Flood Map for Planning is the statutory dataset used in planning decisions and shows the undefended floodplain. The Check Your Long Term Flood Risk service is a public-awareness tool whose rivers-and-sea results include the effect of defences, which is why a defended site can read as low risk there while sitting in Flood Zone 3 on the planning map. Only the Flood Map for Planning can support a planning application.
Does the Flood Map for Planning show surface water depth now?
Yes. Since 28 May 2026 the surface water layer includes banded depth data in seven bands, from under 150mm to over 2,300mm, for the 3.3%, 1% and 0.1% annual chance events, present day and with climate change. Equivalent depth data for rivers and the sea is due to follow later in 2026.
Is the Flood Map for Planning free to use?
Yes. It is a free public service on GOV.UK, searchable by postcode, place name or grid reference. You can also request the underlying data from the Environment Agency, and the datasets are published on the Defra Data Services Platform for use in GIS.
Can a site in Flood Zone 1 still need a Flood Risk Assessment?
Yes, and under the August 2026 NPPF the trigger has widened. A Flood Zone 1 site of one hectare or more still needs an assessment. But Policy F4 now also expects one wherever the Flood Map for Planning or the Strategic Flood Risk Assessment shows the land at risk from any source, now or in the future, including surface water and a critical drainage area. Flood Zone 1 only means the risk from rivers and the sea is low, not that other sources have been ruled out.
Did the August 2026 NPPF change the Flood Map for Planning?
The map's data did not change on 17 August 2026, but the policy around it did. The NPPF now defines the Flood Zones the map shows in its own Annex F, Table 1, rather than leaving them to guidance, and Policy F4 ties the requirement for a Flood Risk Assessment more directly to what the map displays. The map looks the same but carries more formal weight. Our summary of the August 2026 NPPF changes covers the detail.
Is there a Flood Map for Planning for Wales?
Yes. Natural Resources Wales runs the equivalent service for Wales, which sits under TAN15 and Planning Policy Wales rather than the NPPF. The planning tests and flood map work differently there, so a Welsh site is read against its own framework, not the English Flood Zones.
Latest news

One of our experienced Flood Risk Consultants will get back to you within 60 minutes
