Communities Affected by Groundwater Flooding in the UK

Estimated reading time 17 minutes
Groundwater flooding is not spread evenly across the country. The areas affected by groundwater flooding cluster in a narrow band of communities sitting on or just downstream of the Chalk, and the same villages tend to flood again and again: parts of Dorset, Wiltshire, Hampshire, Berkshire, Oxfordshire, Buckinghamshire, Kent, Surrey, Sussex and the East Anglian chalk. The British Geological Survey estimates that between 122,000 and 290,000 properties in England lie in areas at risk. Because national flood maps do not show groundwater, a site in one of these areas usually needs a site-specific groundwater flood risk assessment rather than a look at the published mapping. For what groundwater flooding is and how a rising water table drives it, start with our explainer on groundwater flooding causes and risks.
Between 122,000 and 290,000 properties in England sit in areas susceptible to groundwater flooding, of which 46,000 to 138,000 are on chalk and limestone.
Two extremes in seven months: the winter that flooded and the summer that did not
In January 2026 the chalk of Dorset and Wiltshire produced the worst groundwater flooding since 2014. Six months later the same counties were in drought. Both events came out of the same rock, and the second is partly explained by the first, which is the single most useful thing to understand about the communities this affects.
Winter 2025-26 was England's eighth wettest on record, at 142 per cent of average rainfall, and southern England's fourth wettest since 1884. Storm Chandra on 26 and 27 January tipped already-full aquifers over. At Dickley Down in west Dorset the borehole exceeded its previous maximum and rose by nearly six metres in twenty-four hours. By 11 February, 34 of the 35 groundwater flood warnings covering the two counties were in force. The Environment Agency recorded groundwater impacts for communities it had not seen before.
| Period | What happened | What the aquifer did |
|---|---|---|
| Oct 2025 – Jan 2026 | 629 mm of rainfall across the at-risk areas; the middle Stour had its wettest January since 1891 | Sustained recharge, with the water table climbing through autumn and winter |
| 26–27 Jan 2026 | Storm Chandra, followed by a further 120 mm in eight days | Dickley Down rose nearly 6 m in 24 hours and passed its record high |
| 11 Feb 2026 | 34 of 35 Environment Agency groundwater flood warnings in force across Dorset and Wiltshire | Levels at or above those of 2013-14 |
| March 2026 | Flooding receding, but rivers and streams still full | Slow recession, with the aquifer still holding a large volume |
| July 2026 | England's driest July since the series began in 1836: 6.5 mm, 10 per cent of average. Southern England had 1.9 mm | No summer recharge, but levels falling from an exceptionally high start |
| August 2026 | 71 per cent of England formally in drought; 29 million people under water restrictions | No record lows, and many chalk sites still normal for the time of year |
Then July arrived. England recorded 6.5 mm of rain, ten per cent of the average and the driest July since the series began in 1836. Southern England had 1.9 millimetres. In the England and Wales rainfall series that runs back to 1766, the UK Centre for Ecology and Hydrology recorded it as the fifth driest of any month in 260 years. The National Drought Group declared further areas in drought on 10 August, and by 20 August 71 per cent of England was formally in drought. Yet on 16 August the British Geological Survey reported that of 35 monitored boreholes, 15 were normal or above normal and none was at a record low, and it attributed that to the winter recharge.
There's far more storage in our groundwater systems than there is in our surface water reservoirs or our rivers, so it's a huge store of water.
Dr Christopher Jackson · Head of Environmental Modelling, British Geological Survey
That is the position these communities live with. The property that pumped water out of its cellar for six weeks in February belongs to the same chalk aquifer that is keeping the taps running in August.
Which parts of the UK are affected by groundwater flooding?
The areas affected by groundwater flooding follow the chalk and limestone outcrops of southern and eastern England, with a second, quieter set of cases in river valleys floored by sand and gravel. The distribution is geological rather than administrative, so it cuts across county boundaries and can change over a few hundred metres.
- West Dorset. The Cerne, Sydling, Piddle, North Winterborne and South Winterbourne valleys. The Environment Agency's warning area for the South Winterbourne alone covers Winterbourne Abbas, Winterbourne Steepleton, Martinstown, Winterbourne Monkton, Winterbourne Herringston and Winterbourne Came, all named after the seasonal stream that runs through them. See our Dorset flood risk assessment page.
- Cranborne Chase. Pimperne, Iwerne, the Tarrants, Crichel, Gussage, the Allen, the Ebble and the Crane, running down to Milborne St Andrew, with Tollard Royal and Sixpenny Handley on the higher ground.
- Salisbury Plain and the Wiltshire bournes. The Dene, Chilmark, Teffont, Tilshead, the Till and the upper, middle and lower Bourne valley. Salisbury city centre itself is affected. See our Wiltshire flood risk assessment page.
- Hampshire and the Berkshire Downs. The dip slope of the chalk downs, where the water table sits deep in summer and can rise tens of metres by late winter. See our Hampshire and Berkshire pages.
- The Chilterns. Covered by Project Groundwater, a six-year Environment Agency programme funded from Defra's £150 million Flood and Coastal Resilience Innovation Programme, working across nine high-risk areas to benefit around 70,000 properties in 200 communities.
- East Kent. The Nailbourne, Petham Bourne and Alkham Bourne systems, taking in Elham, Barham, Bishopsbourne, Bridge, Patrixbourne and Bekesbourne, where flooding recurs on a multi-year cycle. See our Kent flood risk assessment page.
- The North and South Downs. Surrey, Kent and Sussex, where spring lines emerge along the foot of the escarpment and in the dry valleys cut into it.
- The East Anglian chalk. Cambridgeshire, west Norfolk and north Essex, where the chalk is often overlain by till, so the response is slower but longer.
- Sand and gravel river valleys. Not chalk at all: floodplain sites where a shallow water table is in continuity with the river, so groundwater rises as the river rises and stays up after it drops.
Project Groundwater covers around 70,000 properties across 200 communities in the Chilterns and Berkshire Downs alone, against a national estimate of 122,000 to 290,000.
Why the Chalk floods from below
The Chalk is a fine-grained white limestone that crops out in a broad band across southern and eastern England. It is the country's most important principal aquifer and supplies much of its drinking water, and its hydrogeology makes it behave unlike any other British rock when it is full. The mechanism was set out by Richard Bradford and Karen Croker in 2007, and it comes down to a sequence.
- Rain reaches the aquifer almost immediately. Chalk soils are thin, and fractures in saturated chalk let heavy rainfall pass straight through to the water table rather than running off the surface.
- The water table rises fast. The volume of rock through which water can actually flow is small, so a given depth of rainfall raises the water table far more than it would in a more porous rock.
- Gradients steepen towards the valleys. A rapid rise on the interfluves creates a steep hydraulic gradient, and groundwater moves most easily near the surface, at levels the water table rarely reaches.
- The spring line moves up the valley. Streams begin to flow higher up the dry valleys than usual, often where there is no well-developed channel and no history of maintenance, because flow there is rare.
- The water has nowhere to go. Emergent groundwater cannot easily drain away or sink back in, so the flooding sits in place for weeks and sometimes months.
Chalk streams also drain very large catchments, because rainfall on the downs infiltrates rather than running off. When the water table is high, the whole of that catchment discharges out of the aquifer into what is normally a small winterbourne. That is not a stream in flood. It is an aquifer emptying.
No other British aquifer does this to the same degree. Other limestones cause groundwater flooding occasionally, and in the 2026 drought it was the Cotswold oolite, not the chalk, that fell furthest. Sandstones have lower conductivity and higher porosity, so they rarely sustain the flows needed to flood, and their denser drainage networks usually give groundwater somewhere to discharge. That is not the same as never: where a sandstone or a sand-and-gravel deposit outcrops on a valley side, groundwater can and does emerge at the contact. Our guide to the types of flooding and sources of flood risk sets out how this differs from the other sources.
Is your area genuinely at risk?
Being in an affected county is a flag, not a forecast. Groundwater flood risk varies over tens of metres, and two houses on the same street can sit either side of it, because what matters is how high the ground sits relative to the winter water table, and what the superficial deposits do to the flow. A village that flooded in 2014 and 2026 tells you the mechanism is live in that valley; it does not tell you whether a particular plot floods.
The national tools will not settle it. The Flood Map for Planning and the long-term flood risk service map rivers, the sea and surface water, and neither is built to map groundwater. The standard national screening layer is the BGS Susceptibility to Groundwater Flooding dataset, and our guide to checking the groundwater flood risk map for the UK explains what it does and does not tell you. Susceptibility is a hazard band, not a probability that a given building will flood. Our flood risk map by postcode is a useful first look at the other sources.
A dry-season borehole reading on chalk can sit several metres below the true winter peak, which is why a single summer dip is not a design groundwater level.
For a property or a development site, the answer comes from local evidence. Borehole records, the local authority's Strategic Flood Risk Assessment and any history of springs or seasonal ponding will usually get you most of the way. Where it matters, you monitor through a wet season.
What groundwater flooding does to a community
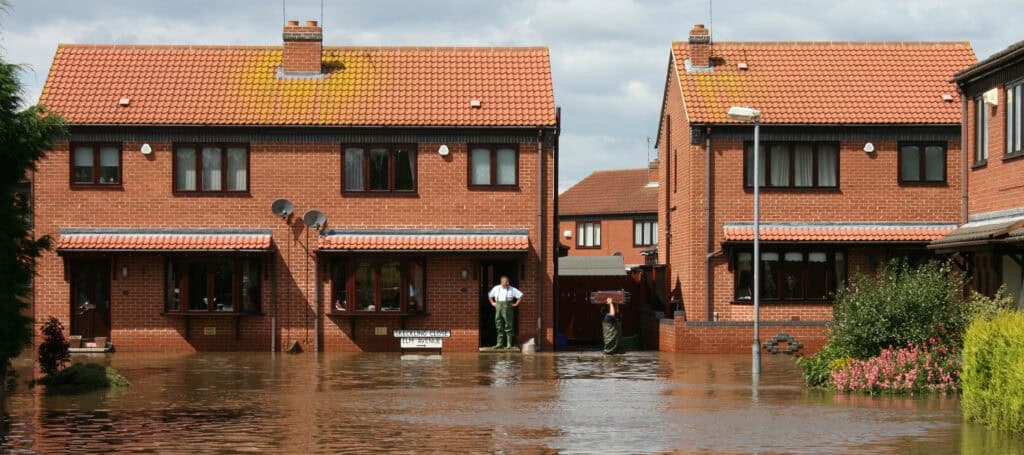
The damage is different in character from a river flood. It is slower, more persistent, harder to keep out, and it reaches places surface water never touches.
- It lasts. Weeks or months rather than hours, so the disruption compounds. Closed roads stay closed, and saturated buildings cannot dry out while the water table is still up.
- It cuts off access. Main routes and rural lanes flood where the water table reaches the surface. In winter 2026 that included the A35 and a long list of minor roads across west Dorset.
- It surcharges the sewers. A high water table infiltrates foul and surface water sewers, which surcharge and push water back into properties through drains and toilets.
- It fills basements first. Below-ground rooms flood earliest and stay wet longest, and converted cellars used as living space are consistently the worst affected.
- It waterlogs land. Fields, gardens and pitches stay anaerobic for weeks, and septic systems and soakaways stop working while the ground around them is saturated.
- Warnings reach fewer people than they cover. The Environment Agency's groundwater flood warning service covers more than 14,000 properties in Dorset and Wiltshire, but only around 4,000 households were signed up to receive the warnings.
Conventional defences work poorly here. Sandbags and door barriers are designed to stop water arriving horizontally. Groundwater arrives through the floor and through the walls under hydrostatic pressure, and it keeps arriving.
Who is responsible when groundwater floods a community?
Responsibility is split, which is why residents often find that nobody appears to own the problem. The Royal Town Planning Institute has made the same point about the planning system, noting that there is no statutory consultee for groundwater flood risk and no freely available national groundwater flood risk data. The Lead Local Flood Authority, normally the county or unitary council, is responsible for managing flood risk from groundwater under the Flood and Water Management Act 2010. The Environment Agency holds the strategic overview for all sources of flooding and runs the alert and warning services where a history of groundwater flooding justifies one.
| Body | What it is responsible for | What to ask it |
|---|---|---|
| Lead Local Flood Authority | Managing groundwater flood risk locally; investigating significant flooding under section 19 of the Flood and Water Management Act 2010; maintaining the Strategic Flood Risk Assessment | Whether a section 19 investigation has been carried out for your area, and what the SFRA says about groundwater |
| Environment Agency | Strategic overview of all flood sources; groundwater alerts and warnings in historically affected areas; groundwater level monitoring | Whether your property sits in a groundwater flood warning area, and whether your household is signed up |
| District or borough council | Emergency response, sandbags where they help, and planning decisions on new development | What its policy is on basements and on development in groundwater-affected areas |
| Water and sewerage company | The public sewer network, including infiltration into it | Whether sewer surcharge in your area is being recorded as groundwater infiltration |
| Property owner | Your own drainage, and riparian responsibilities where a watercourse crosses your land | Nothing, but keep a dated record of what floods, when, and how deep |
The Environment Agency's dedicated groundwater flood warning service for Dorset and Wiltshire has been running since February 2019, covering more than 100 vulnerable communities. Winter 2026 was its first large-scale test rather than its beginning, and the gap between the 14,000 properties it covers and the 4,000 signed up is the most easily fixed problem in this article.
What communities and property owners can actually do
There is no equivalent of a flood wall for groundwater, and the honest position is that the options are about managing water that will arrive rather than preventing it. The sequence below is what a hydrogeologist would work through, and it differs from the surface water playbook.
- Sign up for the warnings, if your area has them. The Environment Agency runs groundwater alerts and warnings in historically affected areas, and coverage is far ahead of take-up.
- Establish what the water table actually does. A single reading proves nothing on chalk. What matters is the seasonal range and the winter peak, which is why groundwater monitoring for planning runs through the wet season rather than whenever a programme allows.
- Manage the water rather than sealing against it. Tanking a basement against a rising water table can fail on uplift, or simply move the problem, and a pumped sump system with a reliable power supply often outperforms a sealed structure. Which applies depends on head, depth and construction.
- Check the drainage before you check the barriers. Non-return valves on foul connections, clearing and maintaining ditches and highway drains, and keeping the dry valley's flow route open all matter more than a door barrier.
- Record it. Dated photographs, depths and durations are the evidence base for a section 19 investigation, an insurance claim, and any future planning objection.
- Get the risk assessed properly before you build, buy or extend. On a groundwater site, floor levels, foundation design, basement waterproofing and the drainage strategy all key off a defensible design groundwater level.
For a development site, this is the point where screening stops and evidence begins. Our guide to groundwater flood risk in planning applications sets out what the Environment Agency and the Lead Local Flood Authority expect to see, and where flood defence works alter subsurface flow the consequences can be litigated, as a recent Upper Tribunal case involving a listed building showed.
Unda provides specialist groundwater flood risk assessments for planning applications, property purchases and due diligence, working with experienced hydrogeologists rather than reading a susceptibility polygon and stopping there. We assess the geology and water table behaviour at your specific site, interpret the monitoring and mapping data that exists, and set out the risk and any mitigation in terms a planning authority or an underwriter will accept. If you are buying in a chalk valley, a flood risk survey for a property purchase answers the question at the scale that matters. If a lender or insurer has raised it, a flood risk assessment for insurance is the usual route. If it is a planning matter, a flood risk assessment for planning covers it. Tell us the address and we will tell you what the risk actually is.
Frequently asked questions
How long does groundwater flooding last?
Much longer than a river or surface water flood. Because the water is emerging from a saturated aquifer rather than running off, flooding persists while the water table stays above ground level, which is typically weeks and can be months. In Dorset and Wiltshire the 2026 flooding peaked in late January and early February, and the Environment Agency was still reporting high groundwater levels and full rivers in March.
Can you prevent groundwater flooding?
You cannot stop the water table rising, so prevention in the ordinary sense is not available. What can be managed is where the water goes when it arrives. Sealing a structure is not always the answer: tanking a basement against a high water table can fail on hydrostatic uplift, and a pumped system with a reliable power supply often performs better. The right approach depends on the depth of the structure, the head of water above it and how it was built, which is a design question rather than a product choice.
Is groundwater flooding covered by insurance?
It depends on the policy. Insurers treat flooding from below differently from flooding from a river or the sea, and the wording varies enough that it is worth reading the definitions rather than assuming flood cover includes it. Where cover or premium is the issue, a flood risk assessment for insurance sets out the actual risk at the property rather than the area-wide screening an insurer may be working from.
Can a nearby development cause groundwater flooding?
It can. Anything that changes subsurface flow, including sheet piling, deep foundations, ground raising or an impermeable capping layer, can redirect, slow or trap groundwater and raise levels somewhere else. An Upper Tribunal decision in 2023 found that Environment Agency flood defence works at a listed property in Sandwich had raised local groundwater levels and caused damage. Proving it is difficult without baseline data from before the works, which is exactly why pre-works monitoring matters.
After a dry summer, is groundwater flooding less likely next winter?
Not reliably. A dry summer leaves a large soil moisture deficit that has to be satisfied before rainfall reaches the aquifer at all, which delays the start of recharge and can shorten the window in which levels climb. But the outcome depends on what falls between October and March, not on what happened in August. The British Geological Survey's position in August 2026 was that with typical late autumn and winter rainfall, levels in many aquifers would remain within or return to the normal range.
Does a history of groundwater flooding affect a house sale?
It can affect the transaction more than the price. Sellers are asked about flooding history in the standard pre-contract enquiries, environmental searches flag groundwater susceptibility, and a lender or insurer may ask for more. A property-specific assessment is usually more useful to a buyer than a susceptibility band, because it distinguishes between a village with a flooding history and a particular plot that sits above the flooded level.
About the author. Steve is an independent consultant hydrogeologist working with Unda, and designed the first national map of groundwater flood risk. Unda has been trading since 2014, is a CIWEM Business Partner with CIWEM member and chartered (C.WEM MCIWEM) consultants, and has delivered 5,000+ flood risk assessments and drainage strategies across England and Wales.
Dr Steve Buss · PhD, MSc, BA (Hons), CGeol, FGS
Latest news




One of our experienced Flood Risk Consultants will get back to you within 60 minutes
