The Great Flood of 1968: what two floods taught UK flood risk practice
Estimated reading time 14 minutes
The Great Flood of 1968 is really two floods. In July, a single night of rain over the Mendips tore bridges out of the Chew Valley and killed seven people. Ten weeks later, in the middle of September, much of South East England disappeared under water. Both events carry the same name. The confusion matters, because between them they reshaped how flooding in England is recorded, modelled and planned for. More than fifty years on, the question worth asking is what a flood risk assessment still takes from it.
Between them the two floods of 1968 put around 14,000 properties under water in the South East and killed seven people in Somerset. They also left a written record that hydrologists are still re-reading with modern tools.
Which flood was the Great Flood of 1968?
Two floods in 1968 are both called the Great Flood, and the first of them came on the night of 10 July, when a storm stalled over the Mendip Hills and sent the River Chew tearing through Chew Stoke, Pensford and Keynsham. The second was a slow regional river flood on 14 and 15 September, when a stalled rain band put Lewisham, Crawley, Tonbridge and Tilbury under water. Different causes. Different timescales. Different lessons.
The distinction is worth pinning down. The two events are still mixed up all the time. Channel 5's documentary The Great Flood of 1968, first broadcast in October 2024, is about the River Chew rather than Lewisham. That is why a search for one flood so often turns up material about the other.
| July 1968 | September 1968 | |
|---|---|---|
| Dates | Night of 10 July | 14–15 September |
| Type | Flash flood | Regional river flooding |
| Where | Chew Valley, Mendips, north Somerset, south Bristol | Surrey, Sussex, Kent, south Essex, south-east London |
| Rainfall | 175mm in 18 hours at Chew Stoke | 201mm at Tilbury; over 100mm across 6,250 sq km |
| Duration | Hours | Two days of rain, a week of standing water |
| Deaths | Seven | None recorded in the South East |
| Signature damage | Bridges destroyed at Pensford and Keynsham | Around 14,000 properties flooded |
What caused the Great Flood of 1968?
The September flood was caused by a weather front that stopped moving. Warm, wet air drifting up from the Mediterranean met cooler air sitting over the South East, and the boundary between them parked over the region for roughly 48 hours. Rain fell, and kept falling. The Quaggy Waterways Action Group records 201mm at Tilbury and 200mm at Stifford, with more than 100mm falling across some 6,250 square kilometres from Hampshire to south Essex.
What made it destructive was the ground underneath. The summer had already been wet, so the soil was saturated before the storm arrived and rain that would normally have soaked away instead ran straight off fields and streets into rivers that rose faster than anyone could manage. Nothing about that is unusual. It is simply what a saturated catchment does. This is fluvial, or river, flooding, still one of the main sources of flood risk in England, and 1968 remains one of the clearest examples of how quickly it takes hold.
Antecedent wetness is why the same rainfall can pass without incident in June and flood a town in September. It is also why a modern assessment models the whole catchment rather than the storm alone.
Rainfall, catchment, ground condition, then what the river does next. That is the same chain of reasoning a site-specific flood risk assessment for planning has to set out for a local planning authority today, and the reason a report that stops at the rainfall figure never survives consultation.
July 1968: the Chew Valley flash flood
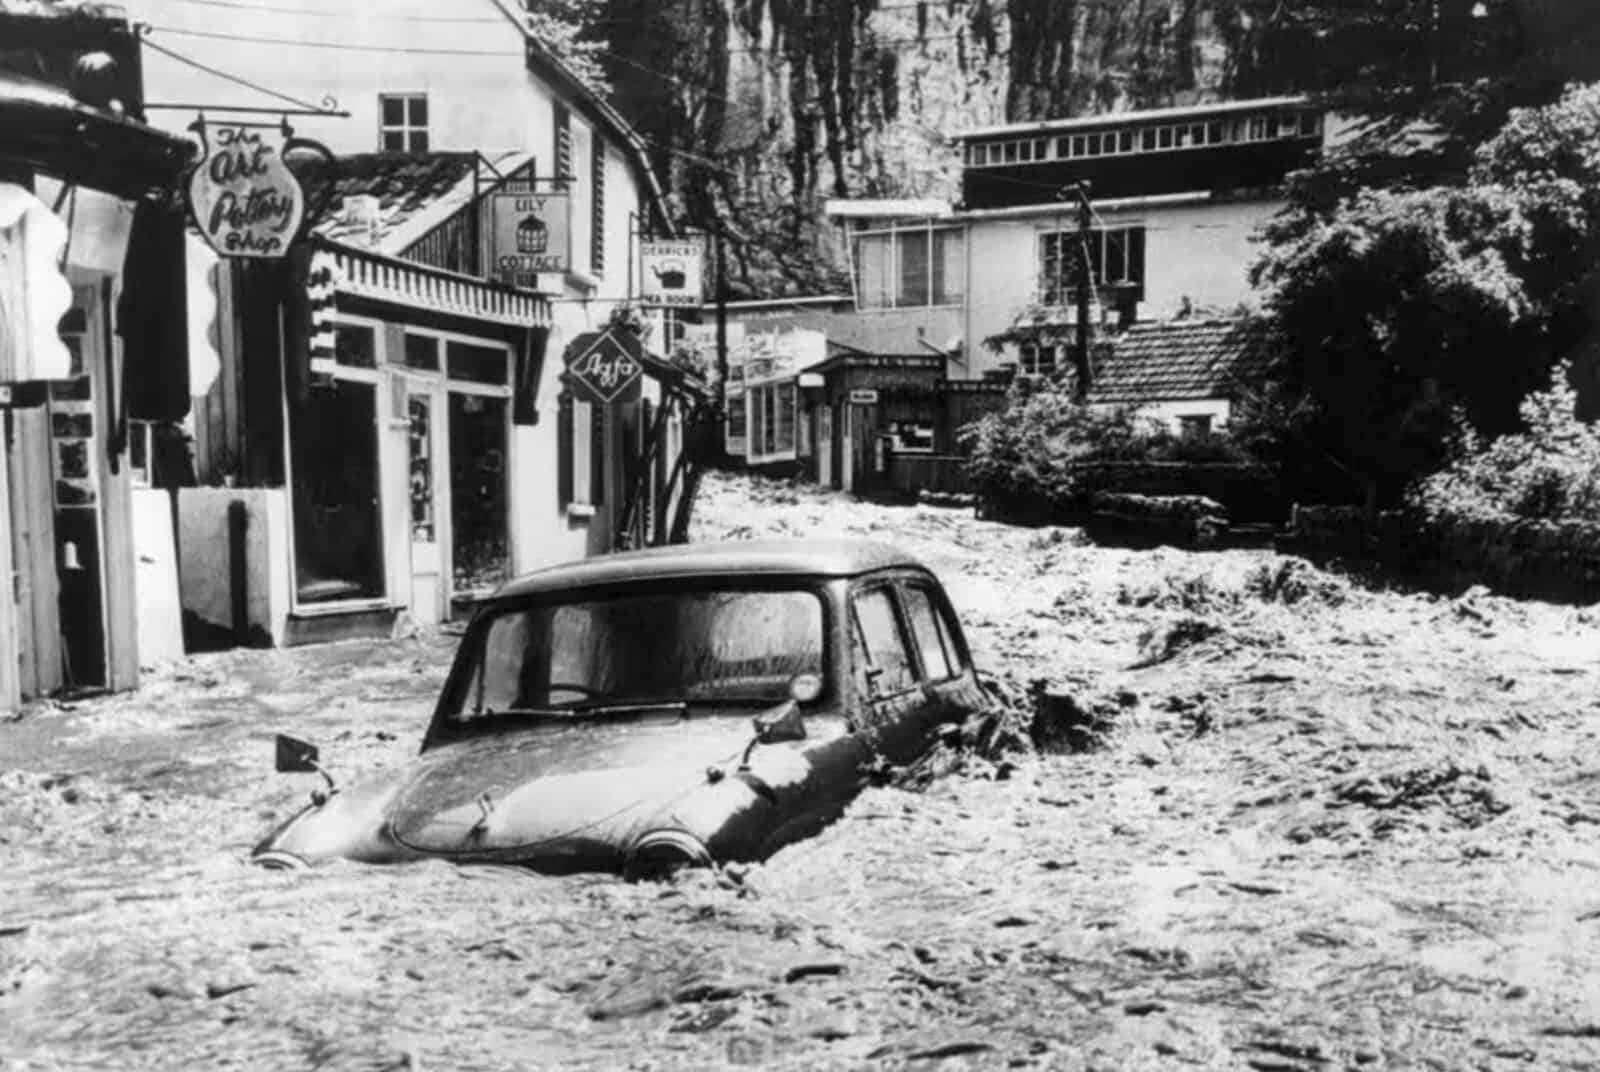
The July flood was a different animal. A Spanish plume drew hot air north over an unstable atmosphere, and the storm that formed sat over the Mendips through the night of 10 July and dropped around 175mm of rain in 18 hours at Chew Stoke. Roughly double the area's average rainfall for the whole of July. In one night. The Met Office library holds an account written at the time of the storms and floods of July 1968 on Mendip.
Water reached first-floor level in parts of the valley. Publow with Pensford Parish Council records more than five inches of rain in 24 hours and a night in which the village lost its main crossing.
- Pensford. The stone road bridge, built in the 1800s, was swept away, leaving a fifty-foot gap in the A37; the army later put in a Bailey bridge.
- Pensford viaduct. Damaged so badly it never reopened.
- Keynsham. The bridge was destroyed and three people drowned there.
- Chew Magna. 88 properties flooded, with water standing eight feet deep.
- Chew Valley Lake. Fears that the dam might be breached caused serious alarm downstream.
- Cheddar Gorge. Boulders were swept through the gorge and the entrance to Gough's Cave was damaged.
Seven people died that night. It remains the deadliest inland flood in England since the war, and it is the reason "the Great Flood of 1968" means Somerset and south Bristol to a great many people rather than south London.
The towns and regions that were hit
Although Lewisham became the best-known casualty of September, the flood was a regional event. The worst-hit towns stretched across the South East, and many of them still sit in catchments that behave the same way.
| Town | County | River or catchment |
|---|---|---|
| Crawley and Horley | West Sussex / Surrey | Upper Mole and Gatwick Stream |
| East Grinstead | West Sussex | Medway headwaters |
| Redhill | Surrey | Upper Mole |
| Tonbridge and Tunbridge Wells | Kent | River Medway |
| Petersfield | Hampshire | River Rother headwaters |
| Tilbury | Essex | Thames-side drainage |
| Lewisham | South-east London | Ravensbourne, Quaggy and Pool |
The Environment Agency, marking the flood's fortieth anniversary, put the total at around 14,000 properties, roughly 10,000 of them homes. It recorded over four inches of rain at Guildford in 48 hours and nearly six at Reigate, double the town's typical September rainfall.
Some of those names sit on Unda's doorstep. Crawley and East Grinstead are a short drive from our Sussex office, and Crawley flooded again in 2000, which we covered in the 2000 Crawley and Gatwick floods. The River Mole saw something close to a 1-in-200-year storm, a useful reminder of how flood return periods and annual probability work in practice, and the Medway put Tonbridge under water.
In Beckenham, the River Ravensbourne came over its banks and put the High Street under water, the kind of localised river flooding that still generates questions today.
The disruption reached well beyond flooded homes. On the morning of 15 September the 9:50 from Charing Cross to Hastings was diverted and then stranded by floodwater at Edenbridge, leaving 150 passengers stuck on board for twelve hours.
Lewisham under water
In Lewisham the rain did not fall hardest, but the geography did the damage. The borough sits where three rivers meet: the Ravensbourne, the Quaggy and the Pool. All three burst their banks at once. The Quaggy, normally a modest channel about six inches deep, rose to something like fifteen feet in places.
People woke on the 15th to boats drifting down the High Street, shopfronts submerged and parks turned into lakes, with Ladywell Park deep enough to row across and the water lingering for the better part of a week. Thousands of homes and businesses were damaged. Getting to work or school was impossible for days.
Lewisham flooded because of the rain over everywhere upstream of it, rather than the rain over Lewisham. That is the single most misunderstood thing about river flood risk.
Much of that river network is main rivers and ordinary watercourses running through dense housing. Riparian ownership and maintenance still matter a great deal there to how water behaves in a storm.
Reconstructing 1968 with a modern model
Historic floods are not closed books. They can be re-opened. In 2024 researchers at Bath rebuilt the July flood as a two-dimensional hydraulic model, feeding technical reports, newspaper accounts and eyewitness testimony into it. Their reconstruction of the 1968 River Chew flash flood put the peak flow at 165 cubic metres per second at Compton Dando.
That figure is 65% higher than the official estimate the event had carried for decades, and the model matched more than 90% of the surviving flood marks.
The number itself is not the point. The point is that a design flow inherited from an older method can be badly wrong, and that the evidence needed to correct it had been sitting in parish records, local newspapers and family photographs the whole time, waiting for someone to model it. The standard maps do not always tell the full story on a particular site, and where they fall short it is hydraulic flood modelling that pins down the depths, flows and extents a planning authority will ask about. Historic flood marks are among the best calibration data a modeller can get.
How 1968 changed the way we treat rivers
For a long time the official answer to flooding like this was to fight the rivers, so channels were straightened, lined with concrete and, in places, buried underground out of sight altogether. That approach held until the mid-1990s. Then thinking began to change.
In Lewisham much of that change was driven from the ground up. The Quaggy Waterways Action Group, formed in 1990, made the opposite case to the engineers.
Let rivers behave like rivers again, with soil and gravel beds acting as natural sponges rather than concrete pipes.
Their restoration work has become one of the better-known examples of natural flood management in an English urban catchment, and it has given the borough some genuinely pleasant green spaces in the bargain. Not a bad return on a campaign run by volunteers.
The flood also stayed in local memory. The In Living Memory project, run through Goldsmiths under the name Lewisham Underwater, gathered residents' stories of 1968 and even produced a commemorative flood beer. That programme closed in autumn 2025 with a new public artwork, Street Waders, installed beside the River Quaggy at Plough Bridge Gardens, linking the memory of the flood to the climate questions we face now.
What a 1-in-100-year flood meant then, and means now
A return period states an annual probability, not a timetable, and the difference trips people up more often than any other idea in flood risk. A 1-in-100-year flood has a 1% chance of being equalled or exceeded in any given year, so two can fall in consecutive winters without anything being wrong with the statistics. The arithmetic has not changed since 1968. The inputs have: the rainfall record is longer, the modelling is better, and a design event now has to be uplifted for climate change before it is any use for planning.
- Establish the historic record. The catchment's known events, including ones like 1968 that predate systematic gauging.
- Derive the design event. Commonly the 1% annual probability river flood, taken from that record and the catchment's characteristics.
- Apply the climate change allowance. The uplift set for the river basin district, the development's lifetime and its vulnerability.
- Test the exceedance case. What happens when the design event is beaten, because residual risk is what actually harms people.
Rising rainfall intensity means the kind of downpour that overwhelmed these rivers in 1968 is modelled very differently now. The government's flood risk and coastal change guidance sets out how those allowances feed into a planning application.
Are these areas still at risk today?
The short answer is yes. Parts of Lewisham, and stretches of the Sussex, Surrey and Kent towns hit in 1968, still fall within the Environment Agency's higher-risk flood zones. Our guide to Flood Zones 1, 2 and 3 explains what those bands mean. You can see how a site is classified on the Flood Map for Planning, or check an address on the government's flood risk service.
"much has been done to protect these areas from an incident of this scale happening again"
Environment Agency, on the fortieth anniversary of the 1968 floods
That is true, and it is also why the maps still show risk. Defences lower the chance of flooding. They do not remove the floodplain, which is why a house behind a new wall can still sit in a Flood Zone. For anyone buying, selling or building in one of these catchments, that history is not a curiosity. It is a reason to look closely at the evidence before committing, and a flood risk survey for a property purchase gives a site-specific read rather than a broad screening colour.
Local knowledge still counts across Surrey and Kent, where the catchments that flooded in 1968 still shape what a local authority asks a developer to prove.
1968 in the bigger picture
The Great Flood of 1968 belongs to a long line of serious British floods, and the pattern of lessons learned and then half-forgotten repeats with uncomfortable regularity. The year 2000 alone brought major flooding to Lewes, York and the River Ouse and the Severn valley, and four years later Boscastle was almost washed away in a matter of hours. Each tells the same story. Water finds its old paths, and the places that flooded before tend to flood again.
One thing sets 1968 apart. So much of it was written down by the people who were there. Sixty years on, that record is doing real technical work.
Worried about flood risk on a site or property? If you are buying or building in a catchment that flooded in 1968, a site-specific assessment shows you the real picture. See the full range of flood risk assessment services, or get a free, no-obligation quote and one of our flood risk consultants will come back to you within the hour.
Frequently asked questions
Do I have to declare a 1968 flood when I sell my house?
The TA6 property information form asks whether the property has ever flooded, and there is no cut-off date, so a flood in 1968 is within scope if you know about it. In practice most sellers of a sixty-year-old flood will not know it happened, and the duty on them is to answer honestly from what they do know rather than to go and research the archives. Our guide to declaring flooding when selling a house sets out where the line falls.
Will a flood that happened in 1968 show on the Environment Agency's flood maps?
Not directly. The Flood Map for Planning shows modelled probability, not recorded history. A property that flooded in 1968 may sit in Flood Zone 1 today if the modelling says the risk is low. One that has never flooded may sit in Flood Zone 3. Recorded outlines are held separately, in the Environment Agency's Historic Flood Map, and are usually obtained from the Agency or the lead local flood authority as part of an assessment.
Can a house that flooded in 1968 still get affordable insurance?
Usually, yes. Flood Re lets insurers pass the flood element of a home policy into a subsidised pool. Eligibility turns on the property being a home built before 1 January 2009, not on its flood history. Our explainer on what Flood Re is covers the exclusions, and a flood risk assessment for insurance is the usual route when an insurer has priced a property on map data alone.
Is the Chew Valley still capable of a flash flood like 1968?
The catchment has not changed shape, so the physical potential remains. What has changed is warning and awareness: the Environment Agency's flood warning service covers the Chew, and Chew Valley Lake is regulated under reservoir safety legislation. The Bath reconstruction matters here because a higher peak flow implies a more onerous design event than the one previously assumed.
Where can I see photographs or film of the 1968 floods?
British Pathé holds newsreel of both events, including footage from Pensford. Channel 5's 2024 documentary covers the Chew Valley flood, with academic and eyewitness contributors. Goldsmiths' Lewisham Underwater archive holds residents' accounts and images of the September flood in south-east London. Local record offices in Somerset, Surrey and Kent hold further material.
Was 1968 the worst flood in British history?
No. The 1953 North Sea storm surge killed 307 people in England on the night of 31 January, and remains by a wide margin the deadliest British flood of the modern era. 1968 holds a narrower title. The September event is still counted the worst inland flood the Home Counties have seen in a hundred years. The July event was the deadliest inland flood in England since the war.
About the author. Matthew was a Marketing Assistant at Unda when he wrote this article. Unda has been trading since 2014, is a CIWEM Business Partner with CIWEM member and chartered (C.WEM MCIWEM) consultants, and has delivered 5,000+ flood risk assessments and drainage strategies across England and Wales.
Matthew Rousou
Latest news

One of our experienced Flood Risk Consultants will get back to you within 60 minutes