Homes Approved Beside Watercress Beds the Site Did Not Feed
In a Hampshire village, residents believed the springs on an overgrown allotment site fed the watercress beds next door, and the regional mapping put part of the site at high risk of groundwater flooding. Modelling the site's hydrogeology showed otherwise: the beds are fed from the chalk directly beneath them. The council approved the homes subject to conditions, and they were built.
| Client | Small developer |
| Location | A village in Hampshire |
| Watercourse | Spring-fed watercress beds and their perimeter channels |
| Flood risk | Flood Zone 1 · groundwater · surface water · critical drainage area |
| Development | 2–9 dwellings on former allotment land |
| Service | Groundwater Flood Risk Assessment — desk study, site conceptual model, technical report and non-technical summary |
| Outcome | Approved with conditions |
The springs everyone thought fed the beds
The site was the last open ground in the middle of the village: a parcel of allotments gone to scrub, a few fallen trees, two gates onto the lane. A small developer bought it and, on a referral, brought Unda in for a groundwater flood risk assessment before any application was made.
The objection was never about flood zones. The whole site sits in Flood Zone 1, outside any modelled river flood extent. What sat against it were the working watercress beds along the eastern boundary. Watercress is grown in shallow, constantly flowing water and needs it clean and at a steady temperature, so anything that changes what reaches the beds is a commercial problem for the grower. Residents and the growers believed the springs feeding the beds rose on or beside the site. If that were true, every roof, drive and foundation on the plot was a threat to the crop.
Two further things gave it weight. Groundwater has flooded homes in the village within living memory. And the site sits inside a designated critical drainage area, so an assessment was required even in Flood Zone 1. A spring was marked in the middle of the site on the published mapping, which appeared to settle it.
Where the beds' water came from
Rather than take the regional susceptibility mapping at face value, Unda built a conceptual model of the site's hydrogeology: an account of where water enters the ground, where it travels and where it returns to the surface. Historic maps, aerial photographs and a walkover were read against it.
Three things came out of that work. The spring marked in the centre of the site was not a spring; on inspection it was a piped flow laid decades ago, discharging to a ditch. The beds are fed from below, by springs rising through their own base out of the chalk of the Hampshire Downs. And the concrete channel running around the beds had been dug deliberately, to catch runoff from the site and the land above it before that water could reach the crop and chill it.

Those findings reversed the objection. Shallow groundwater under the site, and surface runoff from it, discharge into the perimeter channels rather than into the beds. Of all the water reaching the cress beds, about 0.13% comes from the site. Whatever was built on the plot, the beds would go on feeding themselves from the chalk beneath them.
The map that overstated the risk
The same model settled the flood risk question. Regional mapping showed part of the site at high risk of groundwater flooding. Against site-specific evidence those areas re-ranked to medium and low, and the plot could be developed in full rather than around a mapped zone. Groundwater appears on no national flood map; the published mapping covers rivers, the sea and surface water, and stops there.
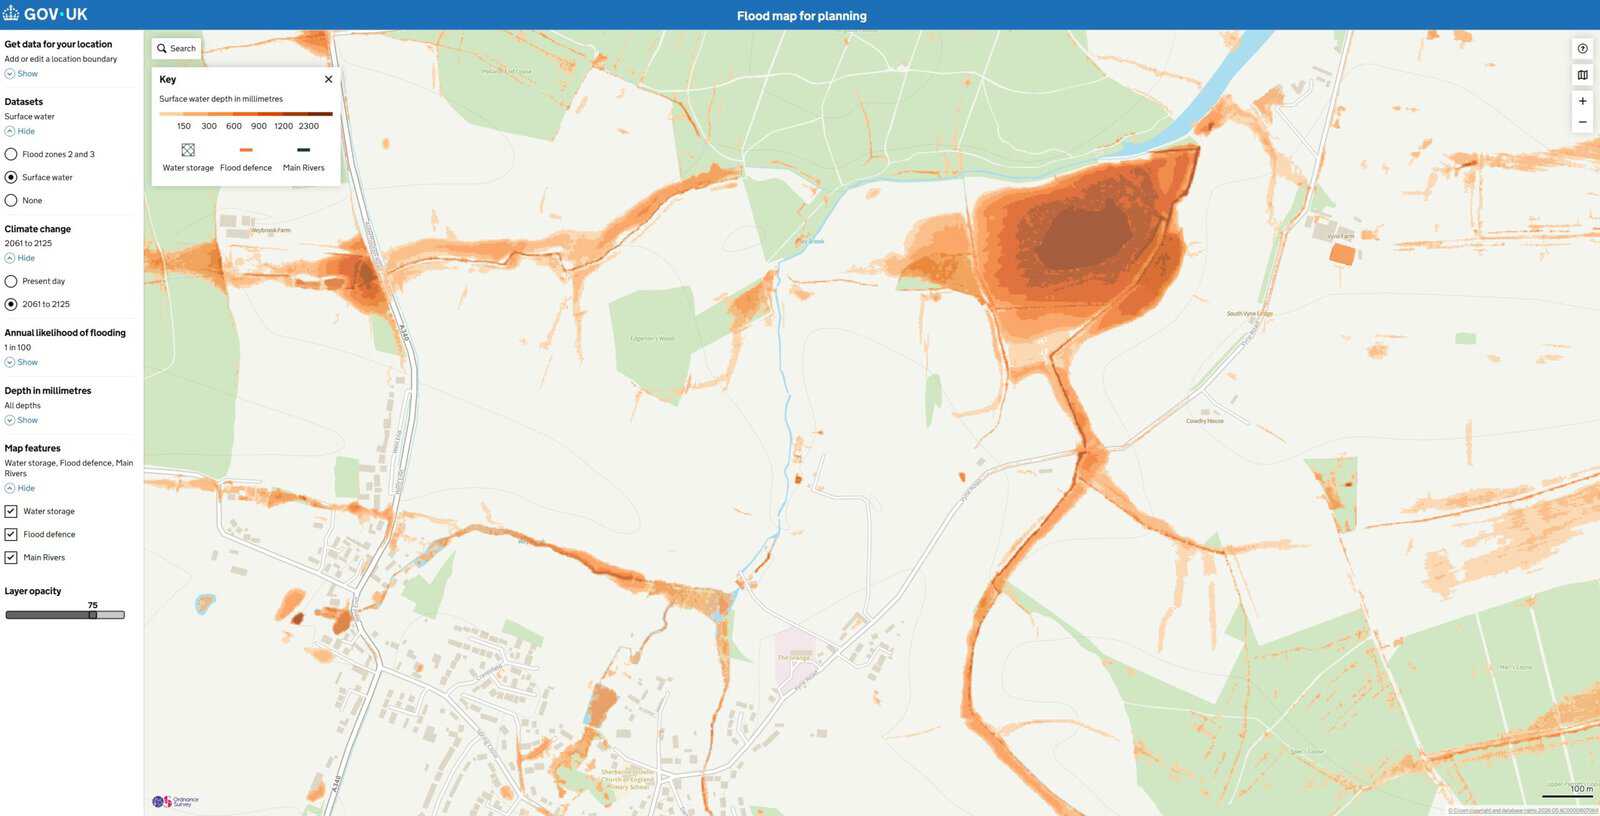
That did not make groundwater irrelevant. It sits one to two metres below the surface in normal conditions, close enough to shape what gets built. Clay subsoils, the shallow water table and the emerging springs ruled out soakaways between them. The drainage strategy instead holds runoff in permeable paving over a sealed storage layer, sized for the 1 in 100 year storm with an allowance for climate change, and releases it slowly to the perimeter channel.
Foundations mattered more than floor levels. Piles were acceptable, but never in continuous runs: a solid line of them across the slope would have dammed the shallow flow the beds sit in, so gaps had to be left for groundwater to pass between them.
Approved, built and occupied
The council granted planning permission subject to conditions, the conditions were discharged, and the houses have since been built and lived in.
Unda issued a technical groundwater conditions report with a non-technical summary beside it. The summary existed so the developer could answer the question in plain terms: at the pre-application meeting, then from residents and the growers, and eventually in buyers' conveyancing searches. Both documents fed the flood risk assessment and drainage strategy submitted with the application. Groundwater was one of several matters weighed, alongside the loss of open space, trees, access and design; the permission did not turn on the water evidence alone.
What this means for similar sites
Regional groundwater mapping shows where the hazard is plausible. It cannot see a perimeter drain, a piped flow, or the depth at which a spring actually rises, and on chalk a site model can move the answer either way. Here it moved down. It does not always, and anyone commissioning one should be ready for the other result.
Where a neighbour's water feature is the real constraint, the questions worth answering early are where its water comes from and where your site's water goes. A walkover and the historic record will often answer both, before anyone commits to a winter of monitoring. Flood Zone 1 is no exemption either: inside a critical drainage area an assessment is required anyway, and what groundwater flooding actually is usually decides the drainage and the foundations before it touches floor levels.
About the author. Jackie is a co-founder and Director of Unda with 30+ years in flood risk, and sits on CIWEM's South Eastern Branch committee. Unda has been trading since 2014, is a CIWEM Business Partner with CIWEM member and chartered (C.WEM MCIWEM) consultants, and has delivered 5,000+ flood risk assessments and drainage strategies across England and Wales.
Jackie Stone · MSci, BSc (Hons), DIC, CIWEM Environmental Partner
A groundwater flood risk assessment gives a developer on permeable ground a design groundwater level to build to, and a clear account of what the site does to the water around it, before a layout is fixed or an objection is lodged.
Is a neighbour's watercourse holding up your site?
Send the site details for a tailored quote from Unda's experienced consultants, within 60 minutes on a working day.
Start a quoteRelated projects
- Groundwater Modelling Shaped Drainage for 130 Homes: readings taken in summer could not show the winter peak needed to size storage, so soakaways were ruled out.
- Village Homes Approved in Flood Zone 3 After an Earlier Flood Refusal: a resubmission with site-specific evidence won permission where a five-page note had failed.
Long, rectangular water channels with lush green watercress plants growing in them, surrounded by trees and grassy areas, with some houses visible on the right-hand side. 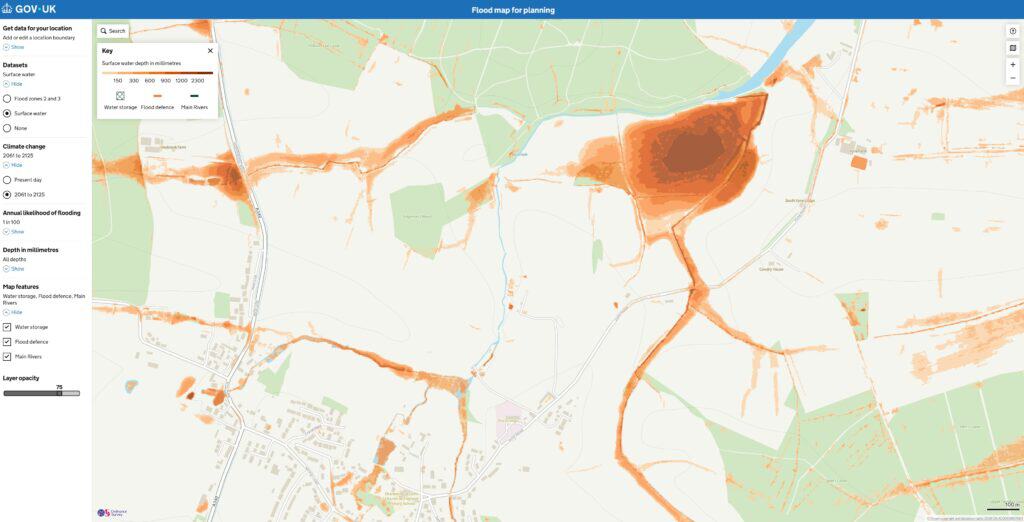 Modelled surface water follows the brook and the lanes. The constraint on this site was groundwater, which no national flood map shows.