Water Table and Groundwater Flood Maps in the UK: How to Check a Site
Estimated reading time 19 minutes
There is no single official water table map for the UK, and no national groundwater flood map either. Rivers and the sea have both. Groundwater has neither. What exists instead is a scatter of separate datasets, each built for a different purpose and none of them designed to answer the question you are asking: a national susceptibility layer from the British Geological Survey, measured groundwater levels in six areas of England, half a century of borehole records, and your council's own strategic flood risk assessment. None of them answers the question on its own.
This guide covers the two questions people actually arrive with. How high is the water table where I live, and could groundwater flood this site? It sets out every source worth using, what each one shows and where it stops, and how a screening map becomes the site-specific evidence that a groundwater flood risk assessment puts in front of a planning officer or a lender. For the mechanism underneath all of it, what groundwater flooding is and why the water table rises, start with our explainer on groundwater flooding causes and risks.
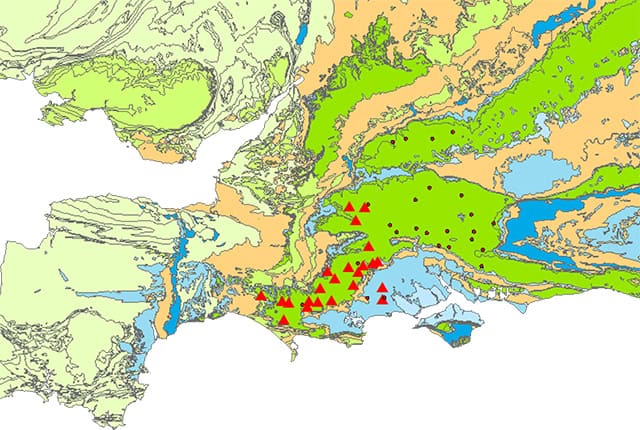
The Environment Agency publishes monitored groundwater levels for six areas of England: Hampshire, Kent, South London, Sussex, Thames and Wessex. Outside them, nobody is measuring the water table for you.
Is there a water table map or groundwater flood map for the UK?
No. There is no national water table map and no groundwater flood risk map for the UK in the sense people mean when they search for one. The nearest thing is the British Geological Survey's Susceptibility to Groundwater Flooding dataset, which maps where the geology could allow groundwater to reach the surface, not where or when it will. Depth to the water table itself is only measured at monitoring boreholes, and those are spread thinly and unevenly.
This catches people out because the national tools look comprehensive. The Environment Agency's Flood Map for Planning shows Flood Zones from rivers and the sea, while the public Check the long-term flood risk service covers rivers, the sea, surface water and reservoirs, and carries groundwater information only where the data exists, which is the six monitored areas below. When the second National Flood Risk Assessment refreshed the underlying data it did not add a groundwater layer to either service. So "we checked the flood map and groundwater wasn't flagged" is not an assessment. Neither map was built to flag it, and outside the monitored areas there is nothing for them to show.
The practical consequence is that checking groundwater takes four or five sources rather than one, and what you assemble at the end is a screening view. Not a measurement.
How to check the water table level by postcode
How deep is the water table in my area is the question behind most of these searches, and the honest answer is that you build it up rather than look it up. Start with the geology, then find real recorded levels near the site, then check what conditions are doing now. No service returns water table levels by postcode as a single depth, because the level moves seasonally and can vary by metres between one end of a street and the other, which is why every attempt to build one has ended up as a susceptibility map instead. These five steps will get you a defensible picture in an afternoon, all from free public data.
- Read the geology first. What sits beneath a site largely settles how groundwater behaves there. Unda's free ground conditions checker reads BGS 1:50,000 mapping for bedrock, superficial deposits and made ground under any UK postcode, and the BGS Geology Viewer shows the same mapping directly. While you have the postcode to hand, our flood risk map covers rivers, the sea, surface water and reservoirs for the same address.
- Pull the borehole records. The BGS GeoIndex holds scanned logs from historic boreholes and wells, many of which record the depth at which water was struck and where it settled afterwards. A borehole log 200 metres away is worth more than any national layer.
- Check the long record. The BGS Groundwater Levels Timeline plots monthly groundwater levels across the UK from 1970 to the present. That lets you see how far a level swings between a dry summer and a wet winter, rather than reading one number and believing it.
- Check live conditions. The Environment Agency publishes current groundwater levels and alerts through Check for flooding, and the UK Water Resources Portal, run by UKCEH with the Environment Agency, SEPA, Natural Resources Wales and DfI Rivers, shows near-real-time levels alongside standardised anomaly indices.
- Read your council's SFRA. A strategic flood risk assessment carries groundwater susceptibility at borough scale, usually with local flood records that never made it into the national datasets.
What none of this gives you is a figure for your plot. Every source above is either mapped at a scale too coarse to resolve a single garden or measured at a borehole that is not on your site, so the honest output of a desk study is a range and a judgement about whether that range matters for what you are proposing to build.
Where the Environment Agency actually monitors groundwater
The Environment Agency publishes groundwater situation reports for six named areas, all of them in southern and south-eastern England. Everywhere else in the country there is no routine published groundwater level for the public to check, and no groundwater flood warning service. It is the most misunderstood point about groundwater data in England, and it is worth being blunt about, because a great deal of wasted effort goes into looking for a national dataset that was never compiled.
- Hampshire. Chalk catchments across the county, the textbook groundwater flooding setting.
- Kent. The North Downs chalk and the East Kent aquifer.
- South London. The chalk beneath the southern boroughs, plus urban groundwater rebound.
- Sussex. The South Downs chalk and its spring lines.
- Thames. The middle and upper Thames catchment, including the Chilterns and the Berkshire Downs.
- Wessex. Dorset and south Wiltshire, the catchments that flooded worst in the winter of 2025-26.
Responsibility matters here too. Government guidance is explicit that lead local flood authorities, meaning the unitary or county council, manage the risk of flooding from groundwater, while the Environment Agency holds strategic oversight and provides monitoring in the places where there is a documented history of it. If your site sits outside those six areas, the LLFA is the body to ask and its SFRA is the document to read.
The official groundwater mapping sources, and what each one costs
Six sources between them make up the whole national picture, and each of them answers a slightly different question, which is why using one on its own so often produces a confident conclusion that will not survive a consultee reading it. Knowing which does what saves a great deal of time.
| Source | What it shows | Coverage | Access |
|---|---|---|---|
| BGS Susceptibility to Groundwater Flooding | Where geology could let groundwater reach the surface. A hazard band, not a probability | England, Wales and Scotland at 1:50,000 | Licensed premium data, £0.35 per km² plus licence and preparation fees |
| EA groundwater levels and alerts | Measured levels now, plus any alerts or warnings in force | Six monitored areas of England | Free, online |
| BGS Groundwater Levels Timeline | Monthly groundwater levels from 1970 to the present | UK monitoring network | Free, online |
| UK Water Resources Portal | Near-real-time levels and standardised anomaly indices | UK-wide, across the EA, SEPA, NRW and DfI Rivers networks | Free, online |
| BGS GeoIndex borehole records | Depths at which water was struck and rested in real boreholes | Great Britain | Free to search and view |
| Local authority SFRA | Groundwater susceptibility at borough scale, with local flood records | Each planning authority | Free, on the council's website |
The standard national screening layer is licensed data at £0.35 per square kilometre. Most of the people looking for a free national groundwater flood map are looking for something that was never published.
The first one catches people out. The BGS susceptibility dataset is the standard national screening layer, but it is not something a homeowner opens in a browser on a Sunday afternoon. Most people meet it second-hand, inside a commercial property flood report or a consultant's assessment, without ever being told what it is. The underlying layer is catalogued on data.gov.uk for anyone who wants the GIS data rather than a picture of it. What a commercial groundwater risk report adds is packaging and interpretation, not new measurement, and no groundwater level map on the market is reading the water table under your plot.
Why groundwater is missing from the Flood Map for Planning and NaFRA2
The Flood Map for Planning was built for one job. Its own dataset description defines it as the extent of land at present-day risk of flooding from rivers and the sea, ignoring the benefits of defences. Groundwater is not in it, has never been in it, and NaFRA2 did not change that.
That is a mapping decision rather than a policy one, and the distinction matters, because planning policy is emphatic that the assessment has to go a good deal wider than the map does.
Areas at risk of flooding are those at risk of flooding from any source, now or in the future. Sources include rivers and the sea, direct rainfall on the ground surface, rising groundwater, overwhelmed sewers and drainage systems, reservoirs, canals and lakes and other artificial sources.
Planning Practice Guidance, Flood risk and coastal change
So the gap in the maps is real, and it is not a defence. The comparison people most often get wrong is a groundwater flooding map against the Flood Map for Planning, because the two look alike and answer different questions. A site can sit comfortably in Flood Zone 1, the lowest risk from rivers and the sea, and still carry a groundwater constraint serious enough to rule out a basement. Reading one map as though it covered the other is the commonest way groundwater gets missed until it is expensive to fix, and it sits alongside the more familiar mix-up between the Flood Map for Planning and the long-term flood risk service.
Where groundwater flooding actually happens, and why
The British Geological Survey identifies three settings in the UK where significant groundwater flooding occurs. Nearly every affected community falls into one of them. That is why the risk clusters so sharply instead of spreading evenly across the country.
- Unconfined major aquifers, above all the Chalk. Chalk holds and transmits enormous volumes of water, and after a wet winter the level inside it can rise by several metres. Dorset, Hampshire, Wiltshire, Berkshire, Oxfordshire, Kent, Surrey and West Sussex are all repeatedly affected.
- Shallow unconsolidated sedimentary aquifers. River gravels and alluvium on a valley floor sit close to the surface and respond fast, flooding cellars and low ground alongside a river without the river itself ever topping its banks.
- Groundwater rebound beneath cities. Where heavy industrial abstraction stopped decades ago the water table has been climbing back towards its natural level, threatening basements and tunnels built when the ground was drier.
The Chalk case is the one to understand, because it explains the seasonality that makes groundwater so awkward to evidence, and because it accounts for most of the affected housing stock in England. BGS estimates that between 122,000 and 290,000 properties in England lie in areas at risk of groundwater flooding, a range wide enough to tell you how coarse the underlying data is. When it does arrive it is slow to leave, sitting in a village for weeks or months after the rain has stopped.
How to read a susceptibility map without over-reading it
Reading a groundwater flood map comes down to one distinction. Susceptibility is a hazard band, not a probability, so a high rating means the geology could support groundwater flooding rather than that a given building will flood, and no water table map or water table depth map anywhere carries the resolution to say otherwise. BGS describes the data as identifying areas where geological conditions could enable groundwater flooding to occur and where groundwater may come close to the ground surface. Conditions, not outcomes.
Two further things trip people up. The first is resolution: the dataset is mapped at 1:50,000 with an effective resolution of about 50 metres by 50 metres, so one boundary line can run clean across a single field and no property-level conclusion can honestly be read off it, however sharp the line looks on screen, which is the same reason a property can flood when the map says low risk. The second is the wording on modelled commercial maps. A layer labelled "1% annual probability" describes how high the water table would be expected to rise in a one-in-a-hundred-year winter. That is a scenario. What happens on a specific plot still depends on the local topography, the superficial deposits and how the water table behaves there.
A screening map tells you whether to investigate. It never tells you whether you will flood.
What every groundwater map shares as a limitation
Whichever source you use, the same five caveats apply to every groundwater map and water table map you will find. A good assessment states them rather than quietly hoping nobody asks.
- Screening resolution. A national layer cannot resolve a single plot, and its boundaries are indicative rather than surveyed.
- Modelled, not measured. Probabilistic maps estimate the water table from rainfall and geology. They are not readings taken at your site.
- Blind to the site. No map knows about your foundations, your basement, made ground on the plot, or how the site drains today.
- A snapshot, not the live level. Maps show risk. The water table rises and falls through the year and between years.
- Unverified until ground-truthed. Anything above low susceptibility on a sensitive scheme needs borehole records and, usually, groundwater monitoring.
From map to evidence: finding your design groundwater level
Where a screening map shows a credible risk, the next step is measurement. A design groundwater level is the single figure that everything else on the scheme is set against, from finished floor levels and basement slabs to foundation design and the invert of a soakaway, and it comes from monitoring on the site itself rather than from any map or dataset.
- Install monitoring. Dipwells or piezometers go into the ground and are read on a regular cycle through a full wet season.
- Read through the winter. The monitoring window runs roughly from November to May, because that is when the level peaks. A borehole dipped in August can sit metres below the true winter maximum, and missing the window can mean waiting another six to twelve months for the next one.
- Set the design level with freeboard. The recorded peak is combined with the record from nearby boreholes and a margin for the winters you did not observe.
- Test infiltration against it. Soakaways have to sit clear of the highest expected groundwater level, so BRE 365 infiltration testing and groundwater monitoring belong in the same programme rather than in sequence.
- Design to the number. Floor levels, waterproofing to BS 8102, buoyancy checks on tanks and basements, and the surface water drainage strategy all follow from the design level.
The order matters commercially as much as technically. Monitoring is the long pole in any programme, so a site that screens as susceptible wants dipwells in the ground before the rest of the design work starts, not after a consultee has asked for them.
Screened as susceptible, and no idea what the level actually is?
Our hydrogeologists specify the monitoring, read the results and set a design groundwater level a consultee will accept. Tell us about the site and we will quote inside 60 minutes.
Get a quote in 60 minutesGroundwater flood risk in a planning application
If a site needs a flood risk assessment for planning, that assessment has to consider groundwater. The National Planning Policy Framework requires every source of flooding to be assessed, so a flood risk assessment that covers rivers and surface water and skips groundwater is incomplete. On a susceptible site the lead local flood authority or the Environment Agency will usually notice, and a holding objection stops the application being determined until the gap is filled.
The submissions that go wrong tend to go wrong in the same three ways. A national flood map is offered as evidence that groundwater is not an issue. A single dry-season reading is presented as the design level. An infiltration-led drainage strategy is proposed for a site where the water table sits above the base of the soakaway for four months of the year. All three are recoverable, but recovering them means installing the monitoring that should have gone in months earlier and then waiting out a wet season for the readings, and our guide to what to submit for groundwater in a planning application sets out what the regulators expect to see instead.
Groundwater delays schemes far more often than it refuses them. Almost always because the monitoring started too late, not because the site was unbuildable.
Where a scheme involves a basement or any below-ground structure the bar rises again, and the consequences of getting it wrong reach past planning. An Upper Tribunal decision on a Grade II listed building in Sandwich found that flood defence works had raised groundwater levels enough to damage the property. Water does not disappear when you block it. It redistributes, and it re-emerges somewhere less convenient.
A susceptibility map is the start of the question, not the answer. Unda turns screening data into a defensible, site-specific position for planning, purchase or due diligence: interpreting the national datasets, specifying and reviewing the monitoring, and designing against a groundwater level that will hold up. See our specialist groundwater flood risk assessment service, or call us on +44 (0) 1293 214444 or email enquiries@unda.co.uk and one of our flood risk consultants will look at a specific site with you.
Frequently asked questions
Is there a groundwater flood map for the UK?
Not a public one. The national screening dataset is the BGS Susceptibility to Groundwater Flooding layer, covering England, Wales and Scotland at 1:50,000, and it is a licensed premium product rather than a free viewer. Northern Ireland is handled separately by the Department for Infrastructure. No official map anywhere in the UK shows groundwater flood risk at property level.
How do I check groundwater flood risk for my property?
Screen the geology and the BGS susceptibility data, read your council's strategic flood risk assessment, and look up borehole logs near the address on the BGS GeoIndex. If the screening comes back as anything above low and the decision matters, meaning a purchase, a basement or a planning application, the honest next step is monitoring rather than another map. For a purchase, that sits inside a wider flood risk survey for a property purchase.
How can I find out the water table in my area?
There is no water table map you can search by postcode. The closest free sources are the BGS Groundwater Levels Timeline for monthly levels since 1970, the Environment Agency's current groundwater levels in its six monitored areas, and the borehole logs on the BGS GeoIndex. Together they give you a range for the area rather than a depth for your plot.
How do I tell if I have a high water table?
The everyday signs are a cellar that weeps through the winter, standing water in a hole dug in the garden that will not drain away, ground that stays soft long after rain, springs or seepage appearing partway down a slope, and soakaways that work in summer and back up between December and March. Any one of these is a reason to have the level measured properly.
Does the UK have a high water table?
It varies enormously. On the Chalk of southern England the water table can be tens of metres down in late summer and within a metre of the surface by March. On valley-floor gravels it may sit a metre or two down all year round. There is no national figure, which is exactly why a site-specific reading matters.
What does groundwater flooding look like?
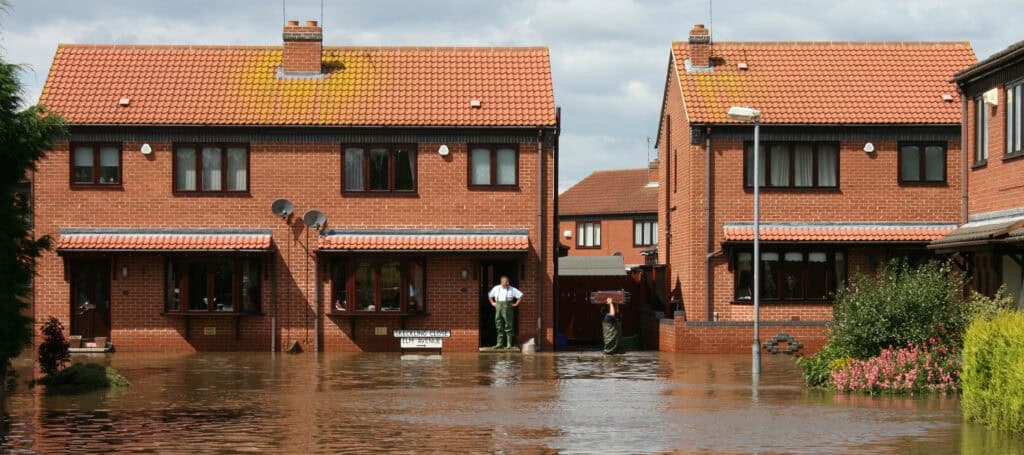
Water rising from the ground rather than running across it. It wells up through floors, fills cellars, emerges from spring lines partway down a hillside and stands in low ground for weeks. It is usually clear rather than silty, it arrives slowly, and it takes far longer to drain away than river or surface water flooding.
How do I know if my house is below the water table?
If the lowest floor sits below the winter groundwater level, the building is effectively inside the water table for part of every year. The symptoms are persistent damp, water coming in at the joint between floor and wall, and hydrostatic pressure under the slab. Confirming it takes a dipwell reading through the wet season, measured against the floor level, not a map.
Does home insurance cover groundwater flooding?
Standard UK buildings insurance normally covers flood damage whatever the source, but repeated groundwater flooding is treated as a claims risk and can affect terms or excesses at renewal. Flood Re supports households in high-risk areas, has never covered homes built after 1 January 2009, and is due to end in 2039. Flood Re publishes its own eligibility rules.
How much does the BGS groundwater flooding data cost?
BGS licenses the Susceptibility to Groundwater Flooding dataset as a premium product at £0.35 per square kilometre, subject to a licence fee, a data preparation fee and the number of users. For a single site it is usually cheaper to get it second-hand, inside a commercial flood report or a consultant's assessment, than to license it directly.
About the author. Jackie is a co-founder and Director of Unda with 30+ years in flood risk, and sits on CIWEM's South Eastern Branch committee. Unda has been trading since 2014, is a CIWEM Business Partner with CIWEM member and chartered (C.WEM MCIWEM) consultants, and has delivered 5,000+ flood risk assessments and drainage strategies across England and Wales.
Jackie Stone · MSci, BSc (Hons), DIC, CIWEM Environmental Partner
Latest news



One of our experienced Flood Risk Consultants will get back to you within 60 minutes
