Flood Risk at Britain’s Landmarks: What Six Famous Sites Reveal

Estimated reading time 12 minutes
Flood risk at the UK’s most famous landmarks is rising, and the pattern it reveals matters far beyond the sites themselves. In its Building Future Communities 2025 report, Aviva uses a handful of Britain’s best-known places — Hampton Court Palace, Cardiff Bay, the Liverpool waterfront, Charlecote Park, Edinburgh Castle and York city centre — to show that even well-defended, closely monitored and heavily invested locations are already flooding more often, or face a clear rise in flood risk by mid-century.
These are not marginal sites on the edge of a floodplain. They are places with river walls, barrages, pumping stations and long histories of maintenance. That is exactly why they are useful. If flood risk is arriving sooner at sites like these, the historic assumptions that sit behind most planning and drainage decisions deserve a hard second look.
Aviva projects the number of English homes at risk of flooding will rise from about 6.3 million today to around 8 million by 2050, an increase of roughly 27%, with surface water the fastest-growing source.
What the Aviva report actually says about flood risk
At a national level, the report expects flood risk to increase from every source by around mid-century. Wetter winters and heavier rainfall drive up river and surface water flooding, while sea level rise and stronger storm surges push up coastal risk. The common thread is that much of the country’s flood defence and drainage infrastructure was designed around historic rainfall patterns, and is now being asked to cope with conditions it was never sized for.
Surface water flooding features repeatedly, especially in urban areas where old drainage networks and extensive hard surfacing leave little room to absorb intense rainfall. It is the source that most often falls outside mapped flood zones, which is precisely why it is so easily underplayed in a standard site appraisal. We cover this gap in more detail in our guide to surface water flooding and planning.
- River (fluvial) flooding: rising as winters grow wetter and rainfall intensifies, testing embankments and barriers built to older design standards.
- Coastal and tidal flooding: driven by sea level rise and storm surge, with barrages and sea walls facing loads beyond their original assumptions.
- Surface water (pluvial) flooding: the fastest-growing source, concentrated in built-up catchments where drainage capacity is already stretched.
Six landmarks, six warnings
Aviva uses a small set of recognisable sites to show how these risks are already playing out, across different settings and different flood mechanisms. Read together, they make a single point: a defended site is not the same as a low-risk site.
Hampton Court Palace, London
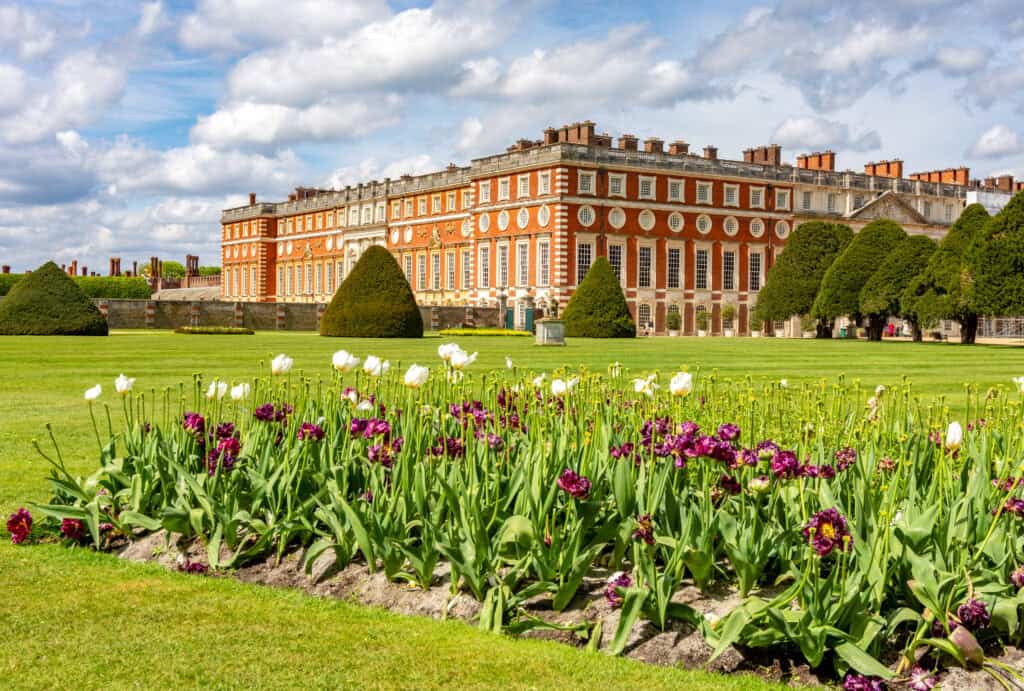
Hampton Court Palace sits on the banks of the River Thames and is inherently exposed to river flooding. The palace itself is protected by substantial river walls and embankments, but it lies within a stretch of the Thames where flood risk is expected to rise as winters become wetter and rainfall more intense by mid-century. Home Park, a 750-acre area of historic royal parkland, currently works as a natural floodplain, and the report expects it to flood more frequently and more severely.
Across the Twickenham constituency, Aviva estimates that the number of properties at risk of both river and surface water flooding could rise by around a third by 2050. Flood defences upstream of the Thames Barrier will also need major upgrades earlier than previously planned, with responsibility split across several owners.
Cardiff Bay, Cardiff
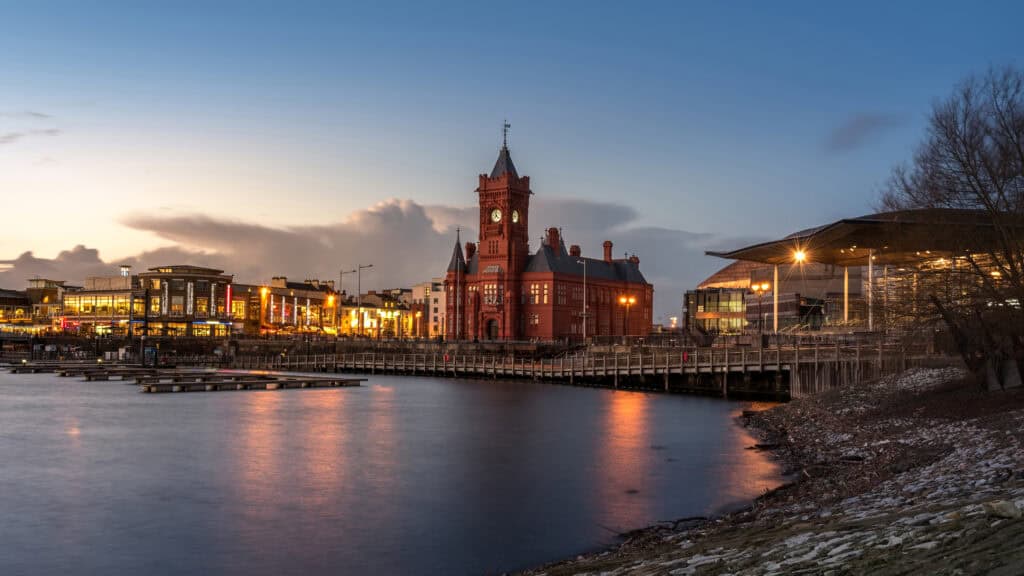
Cardiff Bay is presented as a waterfront exposed to both coastal and river flooding, shaped by sea level rise and heavy rainfall on the River Taff. The report points to Storm Dennis in February 2020, when more than a month’s rain fell in 48 hours and the Taff reached its highest level in over 30 years, beating the previous peak by around 80 centimetres. Residential flooding in the bay was limited compared with other parts of South Wales, but Aviva treats the event as a marker of growing vulnerability.
Sea levels around Cardiff are expected to rise by between 22 and 28 centimetres by mid-century, adding pressure on the Cardiff Bay Barrage, which manages tidal flows and helps hold back storm surges.
One in seven homes in Wales is already at risk of flooding, and that figure is projected to rise by more than a third by 2050.
Natural Resources Wales, cited in Building Future Communities 2025
Liverpool Waterfront, Liverpool
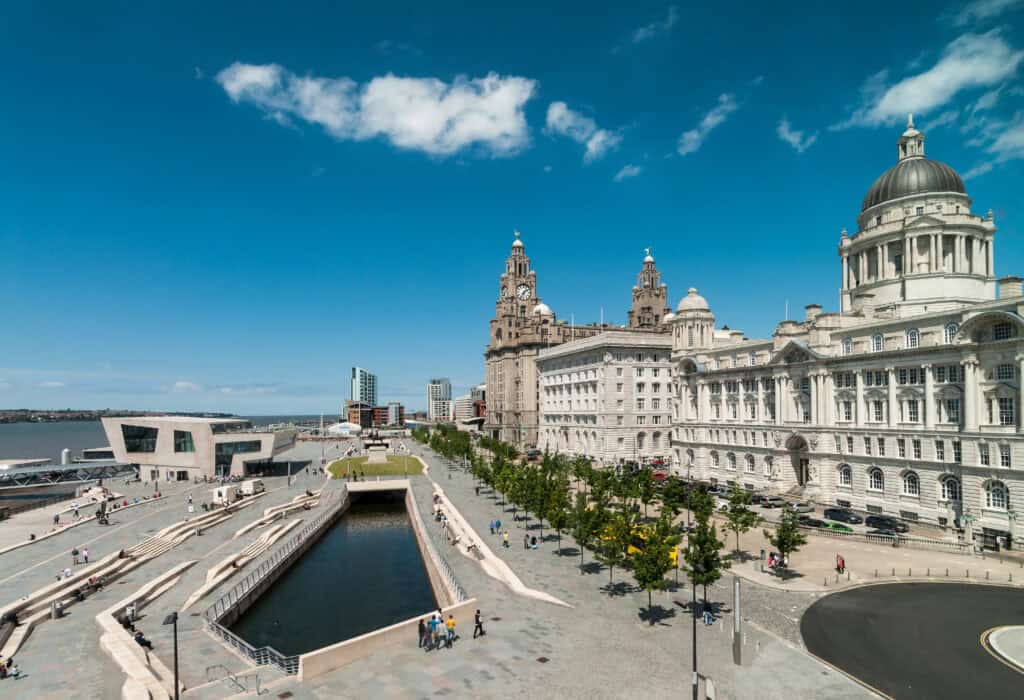
Liverpool’s waterfront is described as a major cultural and economic asset, supporting tourism and a dense concentration of businesses. The report identifies exposure to tidal flooding, surface water flooding and drainage exceedance. Sea levels are projected to rise by up to 40 centimetres by 2050 and potentially by around one metre by 2100, with storm surges in the Irish Sea expected to intensify, and rainfall becoming heavier and more frequent.
Historic dock walls, quay structures and sea barriers currently provide protection, but Aviva notes those defences will be tested more and more over time, placing the waterfront within a higher-risk tidal flood zone. The report points to a continued need for planning controls, sustainable drainage and business continuity planning.

Charlecote Park, Warwickshire
Charlecote Park shows flooding turning from an occasional event into a regular operational problem. The estate sits on a natural floodplain where the River Dene meets the Avon and has always seen some seasonal flooding, but the report documents a sharp recent increase. Aviva expects wetter winters and more intense storms to shorten the recovery time between events and raise the odds of repeated inundation of access routes, car parks and low-lying ground. The National Trust has moved towards operational adaptation and catchment-scale natural flood management through its Nature4Water programme.
Between 2023 and 2024, Charlecote Park flooded five times, closing for 24 days with damage above £246,000; at one point only 9% of the site was accessible.
Edinburgh Castle, Edinburgh
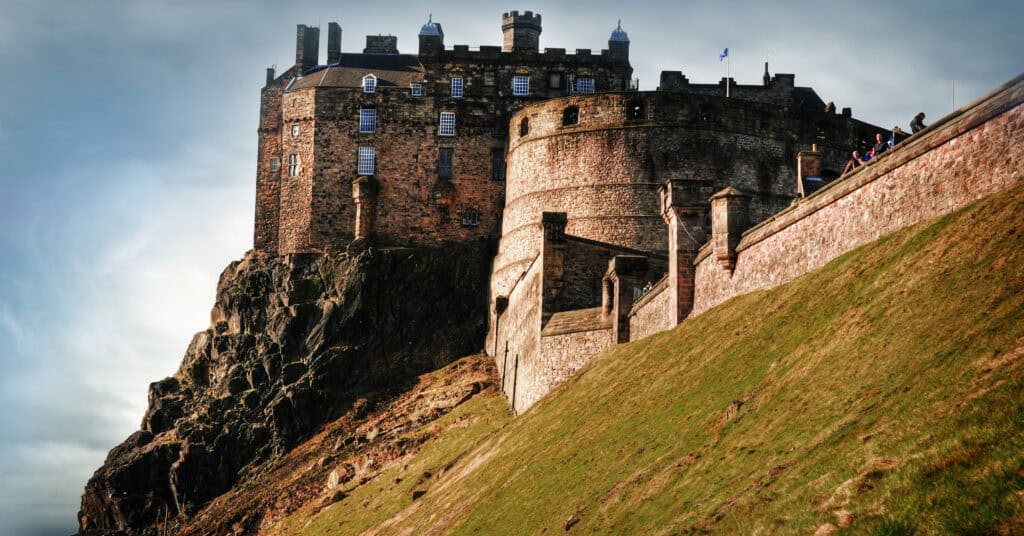
Edinburgh Castle is the clearest reminder that height is no defence against surface water. On 4 July 2021, an intense cloudburst tracked across the city and sat over the castle for roughly 15 minutes, overwhelming historic drainage and sending water across paved courtyards and into buildings. A peer-reviewed study in the Bulletin of the American Meteorological Society recorded 57.6 mm of rain that day at a gauge a kilometre away, about 80% of the month’s average, most of it in minutes.
The report links the flooding to impermeable surfaces, steep gradients and drainage never designed for modern rainfall intensity. Peak rainfall intensities in Scotland are projected to increase by 10 to 20% by 2050. Historic Environment Scotland and the City of Edinburgh Council are now improving drainage, building sustainable drainage into new work and assessing climate risk across the site.

York City Centre, North Yorkshire
York sits at the confluence of the Ouse and the Foss and has a long history of flooding. The report returns to the Boxing Day 2015 flood, when more than 600 properties were inundated and many businesses stayed shut for months. Around £100 million has since gone into flood defences, including a full rebuild of the Foss Barrier, whose pumping capacity rose from 30 to 50 cubic metres per second with eight new pumps.
Those measures protect the city, but the report is clear they will not be enough on their own as rainfall intensifies. Surface water flood risk in the York Central constituency is projected to rise by around 30%, and peak rainfall events by up to 15% by 2050. That is why the response now leans on upstream natural flood management through the Ousewem project, which works across roughly 3,500 square kilometres of the Swale, Ure, Nidd and Ouse catchments to slow and store water before it reaches the city.
| Landmark | Dominant flood mechanism | What the report highlights |
|---|---|---|
| Hampton Court Palace | River (Thames) | Properties at risk in Twickenham up ~a third by 2050; upstream Thames defences need earlier upgrades |
| Cardiff Bay | Coastal and river (Taff) | Sea level up 22–28 cm by mid-century; pressure on the Cardiff Bay Barrage |
| Liverpool Waterfront | Tidal and surface water | Sea level up to 40 cm by 2050, ~1 m by 2100; dock walls increasingly tested |
| Charlecote Park | River floodplain (Dene/Avon) | Five floods in 2023–24; 24 days closed; damage above £246,000 |
| Edinburgh Castle | Surface water | 2021 cloudburst overwhelmed historic drainage; Scottish peak rainfall up 10–20% by 2050 |
| York City Centre | River and surface water | £100m in defences; surface water risk up ~30%; upstream Ousewem scheme |
What the six landmarks have in common
The case studies are not presented as freak exceptions. They illustrate how flood risk is changing in places that already benefit from defences, maintenance and long-term investment, and in several the disruption is arriving through surface water rather than an overtopping river or coastline.
A site can carry every visible sign of protection and still flood, because the defences and drains were sized for a rainfall regime that no longer applies.
Three threads run through all six. Historic drainage is being overtaken by rainfall it was never designed for. Defences reduce risk to a design standard rather than removing it. And the risk that catches sites out most often is the one that sits outside the mapped flood zones. The point of using landmarks is simply that it makes a shift that is easy to ignore much harder to dismiss. As Historic England notes in its own guidance, even heavily protected heritage sites now need active flood planning rather than reliance on past performance.
What it means for planning and development
For anyone bringing forward a scheme, the practical message is that historic flood performance, existing defences and standard drainage approaches are becoming less reliable as a basis for decisions. The same logic that applies to a palace or a castle applies to an ordinary residential or commercial site: the question is not whether a defence exists, but how the site behaves when rainfall exceeds what the drainage was built to handle.
Responding to that shift takes a more joined-up approach, and it is increasingly what determines whether a scheme is delayed, redesigned or refused. In practice that means three things working together.
- Site-specific flood risk assessment that includes surface water and exceedance. A flood risk assessment should account for how water moves across and off the site in extreme events, not just where the mapped flood zones fall. Surface water and pluvial risk need to be assessed in their own right — see our explainer on what pluvial flooding is and why it matters.
- Drainage and SuDS designed around realistic rainfall, not minimum compliance. A surface water drainage strategy built to current and future rainfall intensity, following the SuDS hierarchy and the right climate change allowances, is what keeps a site functional when a design storm is exceeded.
- A clear read on the wider catchment. How a site interacts with upstream inflows and downstream constraints increasingly shapes what is acceptable, as the Ousewem and Nature4Water examples show at landscape scale.
None of this is about treating every site as high risk. It is about replacing an assumption — that the past is a safe guide to the future — with evidence about how a specific site will actually perform. That is the same conclusion Aviva reaches from the other direction in our companion piece on why planning is falling behind flood risk.
Frequently asked questions
Does being behind a flood defence mean a site is safe?
No. Defences reduce flood risk to a design standard; they do not remove it. Every landmark in the Aviva report is defended, and each still faces rising or recurring flooding. Residual risk — what happens when an event exceeds the defence, or the defence fails — has to be assessed on its own terms, which is a core part of a site-specific flood risk assessment.
Is surface water flooding shown on the Environment Agency flood zones?
Not directly. The statutory flood zones map river and sea flooding. Surface water is mapped separately and does not sit neatly within those zones, which is why a site in Flood Zone 1 can still have a real surface water problem. It needs to be screened and assessed as a distinct source rather than assumed away.
Can historic flood records still be relied on for a new scheme?
Only with climate change allowances applied. The whole thrust of the report is that rainfall intensity and sea level are moving beyond the conditions the historic record captures. An assessment should uplift design rainfall and river flows using the current allowances rather than treating past events as the ceiling.
Where can I read the Aviva report in full?
Aviva’s Building Future Communities 2025 report is available to download here: Building Future Communities Report 2025 (PDF).
Planning a scheme where flood risk is the deciding factor?
Unda prepares site-specific flood risk assessments and drainage strategies that account for surface water, exceedance and climate change allowances — the issues these landmark case studies expose.
Get a flood risk assessmentLatest news
One of our experienced Flood Risk Consultants will get back to you within 60 minutes