New Homes in Flood Risk Areas: Is 11% Really Evidence of Planning Failure?
Estimated reading time 12 minutes
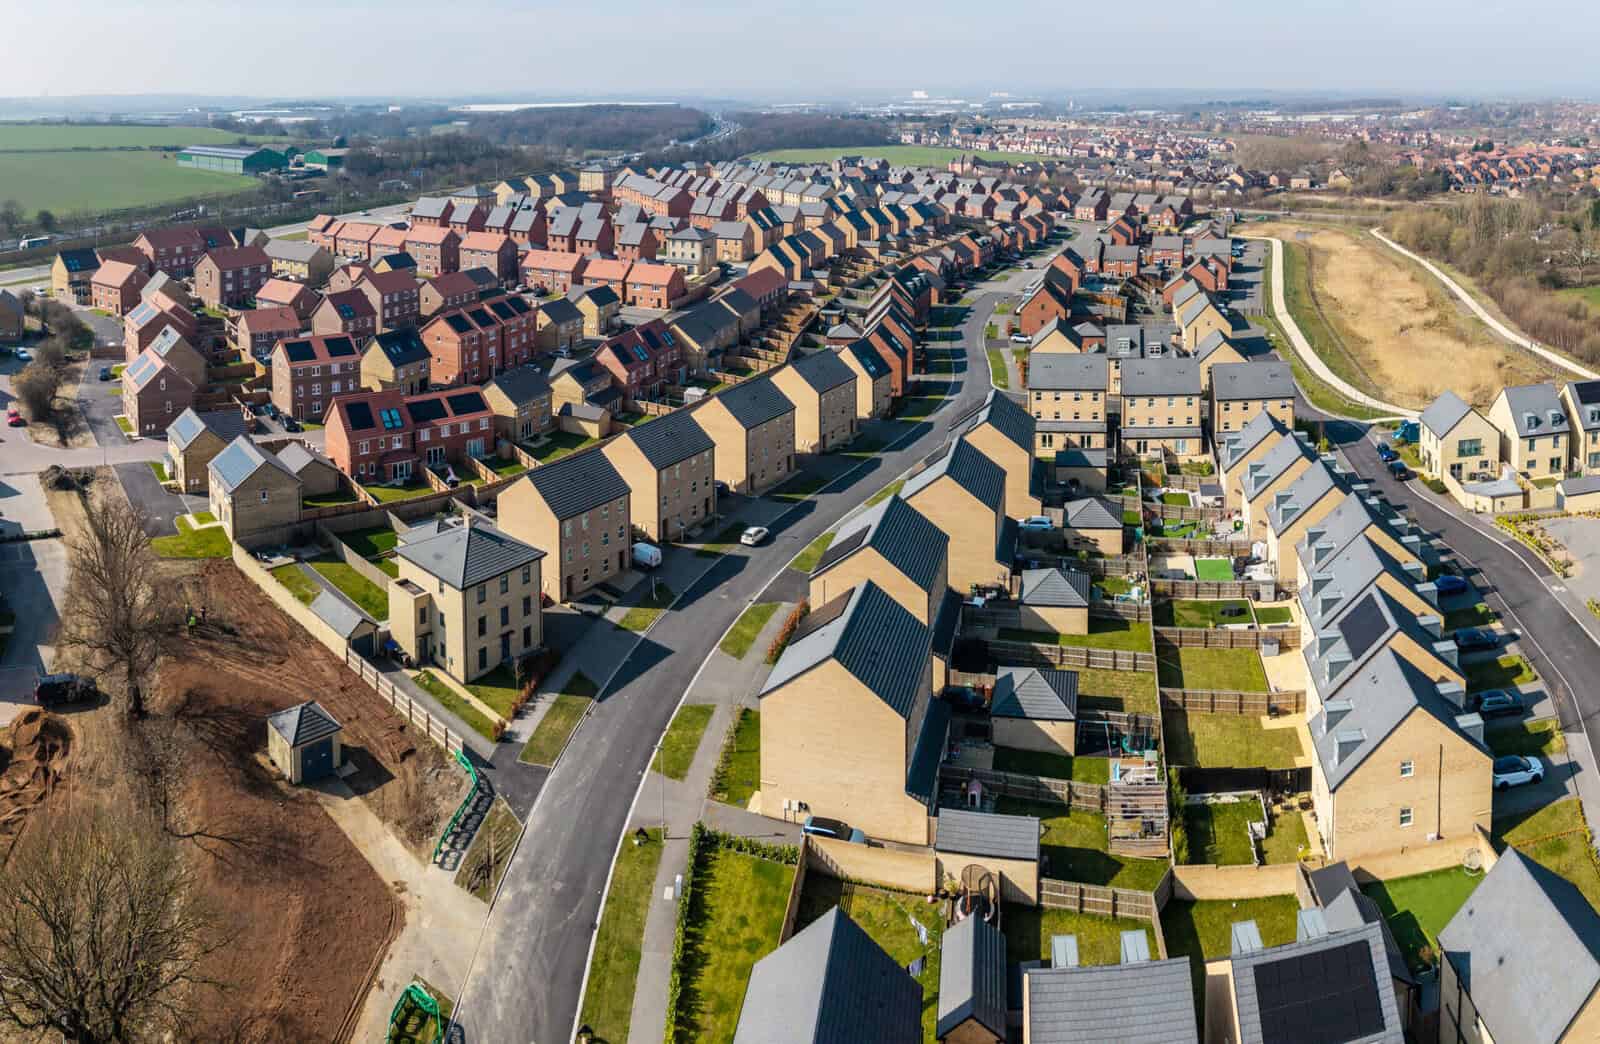
On its own, the one-in-nine figure does not prove that planning has failed. When Aviva reported that 11% of new homes in flood risk areas were built where flooding is a medium or high risk, the headline landed as a verdict on the planning system. It is better read as a national exposure snapshot: a broad measure of where homes sit on a probability map, not a judgement on whether any individual site is safe. The distinction is the whole story, and it is the part the headline leaves out.
A national percentage tells you how many new homes fall inside a mapped risk area. It cannot tell you whether a single one of them is unsafe.
What does the one-in-nine (11%) figure actually measure?
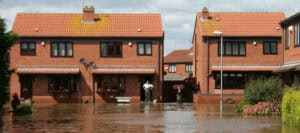
The figure measures exposure, not safety. Aviva found that 43,937 of the 396,602 new homes built in England between 2022 and 2024, which is 11% or roughly one in nine, sit in areas classed as medium or high flood risk under the Environment Agency's latest national assessment. A further 26%, about 101,657 homes, carry some level of flood risk. The 11% is up from 8% for homes built between 2013 and 2022, and Aviva projects that by 2050 around 15% of the recent cohort, close to one in seven, could fall into the medium or high categories as the climate changes.
The method behind the number matters. Aviva combined Ordnance Survey AddressBase data for new homes with the Environment Agency's national flood and coastal erosion risk assessment, drawn together at a broad scale. That produces a reliable picture of how many homes lie inside mapped risk areas. It does not reach the level at which planning decisions are actually made.
Too many new homes have been built in higher risk areas. It's particularly worrying that this trend has risen in recent years.
Jason Storah, CEO, UK & Ireland General Insurance, Aviva
What the national figure does not show:
- Sequential Test: whether each site passed the test that steers development towards land at lower flood risk.
- Exception Test: whether, where it applied, a scheme showed it would be safe for its lifetime.
- Site-specific mitigation: how a detailed Flood Risk Assessment reduced the actual risk to a particular plot.
- Flood defences: how existing walls, barriers and raised defences change the real level of protection.
Does being in a flood risk area mean a home is unsafe?
No. A home in a mapped flood risk area is not automatically unsafe, because national mapping and site safety are two different things. Flood risk in England is described through several overlapping systems, each built for a different purpose, and the one Aviva used is the broadest of them.
| Layer | What it shows | What it is used for |
|---|---|---|
| National flood risk assessment (used by Aviva) | Broad-scale probability of flooding across the country | Strategic exposure: how much of England is at risk |
| Flood Zones 1, 2 and 3 | Probability bands, ignoring defences | Screening a site into the planning process |
| Surface water flood mapping | Where rainfall pools and flows overland | Identifying pluvial risk, now weighed in planning |
| Site-specific Flood Risk Assessment | Modelled levels, defences, floor heights, drainage | Deciding whether a specific scheme is safe |
National mapping rests on probability modelling and broad data. A planning decision rests on a detailed, site-specific assessment that weighs flood defences and their standard of protection, breach and overtopping scenarios, climate change allowances, finished floor levels, compensatory flood storage and the drainage design. Being inside a medium or high risk area sets the questions a scheme must answer. It does not settle them. Planning policy is built to manage risk, not to pretend it can be removed.
National risk map
The 11%: every new home that sits inside a mapped medium or high flood risk area.
Sequential Test
Is there a reasonably available site at lower flood risk? Development is steered there first.
Exception Test
Where it applies: is the scheme safe for its lifetime, and no worse for anyone else?
Site-specific flood risk assessment
Modelled flood levels, defences, finished floor levels, drainage and compensatory storage.
A home that is safe for its lifetime
The outcome a national percentage cannot measure, on the sites that clear every check.
The checks in that sequence are exactly what a national percentage cannot see. A Sequential and Exception Test report and a site-specific flood risk assessment for planning are where a site in a mapped risk area is either shown to be safe or sent back.
England's geography and why we build where we do
England was largely built along its rivers and estuaries. Many of its towns and cities grew up on floodplains, and substantial parts of established urban areas, including districts protected by major engineered defences, lie within mapped risk. Excluding every parcel of land inside a flood risk area would remove large stretches of existing urban England from any further development.
The Thames Barrier protects central London and Westminster; on a national risk map, much of that protected city still reads as at risk.
National policy does not take the exclusion route. It applies a risk-based framework instead, one that accepts a degree of exposure and then requires it to be assessed and managed. That is why a home can sit inside a mapped risk area and still be a reasonable place to build, provided the site-specific work stands up.
How the Sequential and Exception Tests are meant to work
The planning system manages flood risk through two linked tests, applied in order.
- Apply the Sequential Test. Development is steered towards land at the lowest flood risk first. A site in a higher-risk area has to show there are no reasonably available alternatives at lower risk.
- Apply the Exception Test where needed. Where development in a higher-risk area is necessary, the scheme must show it will be safe for its lifetime, will not increase flood risk elsewhere, and where possible will reduce risk overall.
- Evidence it in a site-specific assessment. A Flood Risk Assessment sets finished floor levels, safe access and egress, drainage and compensatory storage against modelled flood levels with a climate change allowance.
On the government's own figures, the procedural framework is largely being followed. In response to the Aviva research, the Ministry of Housing, Communities and Local Government stated that in 2024/25, 96% of all planning decisions complied with Environment Agency advice on flood risk, and 99% of proposed new homes in planning applications complied with that advice.
In 2024/25, 99% of proposed new homes in planning applications complied with Environment Agency flood risk advice.
Compliance rates like these show the process is being worked through. Whether that consistently produces development that stays safe and insurable across decades of climatic change is a separate and harder question, and it is not one a compliance percentage can answer either.
Why did the figure rise from 8% to 11%?
The rise is partly real and partly a change in what is being counted. The earlier 8% covered homes built between 2013 and 2022 that fell within Flood Zone 3, defined using undefended probability thresholds. The new 11% is drawn from the Environment Agency's latest national risk assessment and is not limited to Flood Zone 3. The two figures point in the same upward direction, but they are not a strict like-for-like comparison.
What a national percentage cannot separate out:
- Housing pressure: intensified delivery in authorities with little low-risk land to build on.
- Urban redevelopment: brownfield schemes on existing town-centre floodplains, often behind defences.
- Spatial constraint: growing competition for developable land as targets rise.
- Policy dilution: any genuine weakening of how firmly flood risk is weighed.
The broader trend in exposure, and the way climate projections feed into it, was set out in more detail when the same research first landed, in planning is falling behind flood risk, says Aviva.
Better data, or better decisions?
A second reading has taken hold since the figure was published: the number reflects sharper visibility of risk rather than more flooding, and the system already manages that risk site by site. There is real substance to it. The Environment Agency's move to higher-resolution surface water modelling and its 2026 updates to the Flood Map for Planning give planners and consultants a clearer view of where risk actually sits. Modelling that no longer deflects floodwater neatly around buildings is plainly an improvement.
The catch is that the 11% does not describe the data. It describes the decisions taken on the back of it.
These figures are misleading as the research doesn't even factor in flood defences in place.
Ministry of Housing, Communities and Local Government spokesperson
Better visibility upstream of a decision does not, by itself, change how the Sequential Test is applied at application stage, how Exception Test justifications are scrutinised, or how local plans identify genuinely available alternative sites. Recent appeal decisions, Yatton among them, have shown how thin the alternative-sites evidence can become when it is tested, and how readily a refusal on flood-risk grounds can be overturned. That is a signal about the planning system, not about the data. It is why the live policy work matters: the September 2025 update to the Planning Practice Guidance tightened what counts as a properly evidenced search for alternatives, and the April 2026 changes to the appeals regime push some of that rigour into the stage where it has been weakest. The lessons of that ruling are unpacked in the Exception Test and the planning balance after Yatton and the September 2025 PPG update on the Sequential Test. Better data plus a tightened regime is what moves the figure. Data alone makes the situation more legible; it does not make it less acute.
Resilience and insurability: the longer view
The more consequential issue may be long-term resilience. Homes built after 1 January 2009 are excluded from Flood Re, the government-backed reinsurance scheme that keeps flood cover affordable in higher-risk areas, and the scheme is due to close in 2039. That cut-off was deliberate: it was designed to avoid subsidising, and so encouraging, new building in flood-prone places. New homes in mapped risk areas are therefore priced on the open insurance market from completion.
Flood Re does not cover homes built since 2009 and is scheduled to end in 2039 — a date that falls inside the term of a mortgage taken out today.
If climate change increases the frequency or severity of flooding, the interaction between planning policy, national risk mapping and insurance availability grows sharper. The question worth asking shifts. Less why homes are being built in areas mapped as at risk, and more whether those homes are demonstrably resilient, adaptable and able to stay insurable over decades. That is a question about design and mitigation as much as siting, and it runs through both flood risk and mortgage lending and property flood resilience.
So, is 11% high?
Eleven per cent of new homes in areas mapped as medium or high flood risk is not a small number. But in a country where much of the urban fabric sits in river corridors and coastal zones, some level of exposure was never going to be zero, and sharper flood data does not change that underlying geography.
The more meaningful test is not the headline percentage. It is whether the planning system, through the Sequential Test, the Exception Test and detailed Flood Risk Assessments, is consistently delivering development that is safe for its lifetime and does not increase risk elsewhere. On that measure the one-in-nine figure does not, by itself, prove planning failure. It does underline how much rides on keeping housing delivery and long-term flood resilience aligned as climate risk intensifies.
If you are developing a site that a national map flags as at risk, the way to answer the question the 11% cannot is a site-specific assessment. Unda's flood risk assessment for planning and Sequential and Exception Test reports set out whether a specific scheme is safe, and stand up to the Environment Agency and the local planning authority.
Frequently asked questions
Should I buy a house in a medium or high flood risk area?
A medium or high rating on a national map is a prompt to look closer, not a reason to walk away. National mapping describes an area, not your specific property, and does not account for defences, floor levels or drainage. A property-level flood risk survey establishes the real risk to the building, how deep any flooding would be, and what mitigation exists, so you can weigh the purchase, insurance and mortgage position on facts rather than a postcode.
Can you get a mortgage and insurance on a new-build home in a flood risk area?
Usually, but the terms depend on evidenced risk rather than the map alone. Because Flood Re does not cover homes built since 2009, new-builds in higher-risk areas are insured on the open market from day one, and some lenders apply tighter conditions. A clear, site-specific assessment showing modelled levels, defences and resilience measures is often what lets an insurer or lender price the risk sensibly instead of declining on a flag.
Does a new home in a flood risk area need its own flood risk assessment?
Any site in Flood Zone 2 or 3, and Flood Zone 1 sites of a hectare or more or with mapped surface water risk, needs a site-specific Flood Risk Assessment for planning. That assessment, not the national map, is what determines whether the scheme is acceptable, so it is the document that actually answers the safety question the 11% headline raises.
Will the proportion of new homes in flood risk areas change under the revised NPPF?
The draft revised National Planning Policy Framework keeps the Sequential and Exception Test structure in place, and the September 2025 Planning Practice Guidance update tightened how alternative sites must be evidenced. Those changes are aimed at the decision stage rather than the mapping, so their effect will show in how firmly flood risk is weighed at application and appeal, rather than in an overnight shift to the headline percentage.
Latest news


One of our experienced Flood Risk Consultants will get back to you within 60 minutes
