Flood Depth Data for Rivers and Sea: A Practitioner’s Guide
Estimated reading time 11 minutes
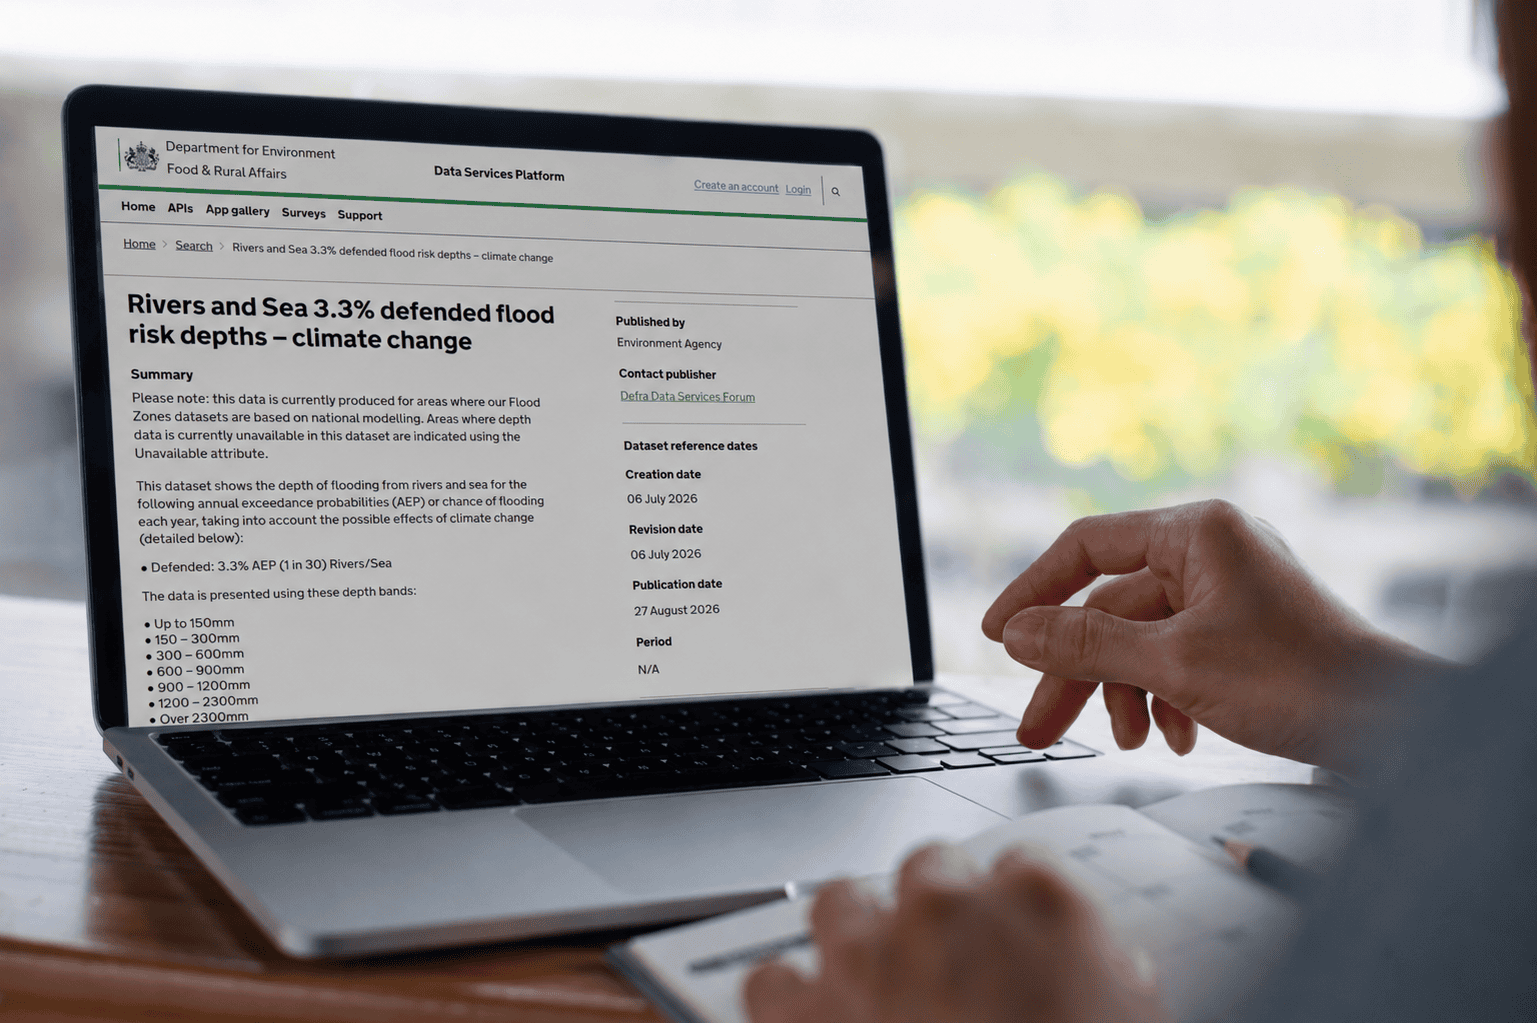
On 27th August 2026 the Environment Agency published flood depth data for rivers and the sea. Four datasets appeared on the Defra Data Services Platform covering present-day and climate change scenarios, defended and undefended, with no announcement, no press notice, and no entry in the agency’s own list of published datasets.
Flood depth data tells you how deep water would sit at a location during a given flood event, reported in bands rather than as a single figure. Surface water got this treatment in May 2026, when banded depths were added to the Flood Map for Planning, but rivers and the sea have until now had extents alone, showing where the water goes without ever saying how deep it gets once it arrives. That gap is now closed. Not completely, though, and the caveat is the part worth reading. This guide sets out what the datasets contain, where they apply, and what they can support in a flood risk assessment for planning.
The depth data covers only those areas where national modelling underpins the Flood Zones. Where a detailed local model drives the mapping, the polygon returns "Unavailable" rather than a depth.
What flood depth data is, and what it is not
Flood depth data is a banded classification of modelled water depth across a mapped flood extent, with each polygon carrying one of seven depth bands and a flood source of either rivers or sea. Treat it as screening evidence. It indicates the depth of flooding likely across an area of land, at a resolution suited to comparing one site against another rather than to assessing a particular building, and the Environment Agency is direct about that limit: its product description states the datasets "are designed to only give an indication of flood risk from rivers and the sea to an area of land and are not suitable for showing whether an individual property is at risk of flooding".
- What it gives you: a banded depth across a mapped extent, for present-day and climate change scenarios, at three annual exceedance probabilities.
- What it does not give you: a water level. Depth is measured from the ground, so turning it into a level needs your own topographical survey.
- What it does not replace: a site-specific hydraulic model. The agency’s own position in examination correspondence is that site-specific modelling should be used in preference to national outputs.
- What it does not change: the Flood Zones. These are supporting datasets on the Data Services Platform, not layers on the Flood Map for Planning.
The datasets available now
Four datasets were published. They split along two axes: the return period grouping, and whether climate change is applied. All are polygon feature classes under the Open Government Licence, covering England.
- 3.3% defended depths, present day: the 1 in 30 annual chance event with defences assumed to function. This is the scenario that informs functional floodplain work.
- 3.3% defended depths, climate change: the same event with UKCP18 allowances applied.
- Defended and undefended depths, present day: the 1% river and 0.5% sea event, and the 0.1% event, each in defended and undefended form.
- Defended and undefended depths, climate change: as above, with allowances applied.
Two quirks are worth noticing before you open them. The 1% river event is paired with a 0.5% sea event rather than a 1% one, which is conventional enough but reliably catches anyone who assumes return periods match across sources, and there is no undefended product at 3.3% at all, in depths or extents, so the 1 in 30 scenario exists only in its defended form. Our explainer on flood return periods and annual probability covers why the thresholds sit where they do.
Defended layers assume flood defences "operate in the way they were intended (or designed) to function", with no asset failure or removal scenarios modelled. Undefended layers ignore defences entirely. On the climate change datasets the allowances differ by source: the central allowance for the 2080s epoch for rivers, and the upper end allowance to 2125 for the sea. One layer therefore mixes a 50th percentile and a 95th percentile, and the only thing telling you which applies to a given polygon is the flood source attribute. In an estuarine location that distinction does real work, and any assessment leaning on the data should say so plainly. We cover the wider question in our guide to climate change allowances for flood risk assessments.
The seven depth bands
Depth comes in seven bands plus a null class, the same seven the Environment Agency used for the surface water depth layers in May 2026. The widths are not uniform, and the coarseness at the top end starts to matter the moment you try to do anything with them.
| Band | Depth range | Width of class |
|---|---|---|
| 1 | Up to 150 mm | 150 mm |
| 2 | 150 – 300 mm | 150 mm |
| 3 | 300 – 600 mm | 300 mm |
| 4 | 600 – 900 mm | 300 mm |
| 5 | 900 – 1200 mm | 300 mm |
| 6 | 1200 – 2300 mm | 1,100 mm |
| 7 | Over 2300 mm | Open-ended |
| – | Unavailable | No depth published |
Look at the sixth band. Spanning 1.1 metres in a single class, it covers everything from a wet ground floor that dries out to a building written off entirely, which is a range wide enough to make the classification almost useless at the point where the answer matters most. No design decision should rest on it.
Coverage: where depth data exists
Depth data exists only where national modelling underpins the Flood Zones, so coverage is narrower than the flood extents it accompanies and stops entirely wherever a detailed local model is what drives the mapping. That restriction is the single most important thing in the release, and it sits in the product description rather than on the dataset pages, which is why most people will miss it.
The rivers and sea defended and undefended depth datasets are currently a subset of these outputs and provide depth data from national modelling only. This data is currently available only for areas where national modelling is used in our National Flood Risk Assessment (NaFRA2).
Environment Agency · Rivers and Sea defended and undefended flood risk depth datasets, Product Description, 3 August 2026
The extents and the depths are not built the same way, and that is the whole issue. Flood extents blend local model outputs with national modelling on the principle of using the best available information in each location, which is why their coverage runs to every catchment above three square kilometres. Depths do not work like that. They exist only where the Flood Zones themselves rest on national modelling, and wherever a detailed local model is what underpins the mapping, no depth is published at all. In those places the depth polygon reads "Unavailable".
A site can sit squarely inside a mapped flood extent and still return no depth at all. Treat "Unavailable" as unknown and escalate it, never as an absence of flooding.
We expect this to be the commonest misreading of the release. Anyone who assumes depth coverage follows extent coverage will under-report flood depth across a site and never find out, because a null reads like a blank rather than an error, and nothing in the data itself distinguishes ground that was assessed and found dry from ground that was never assessed at all. It is the same trap we set out in our piece on whether flood maps are accurate: a national dataset answers a national question, and the gap only shows up at the scale of a single site. Any screening workflow built on these layers has to flag the null class rather than skip past it.
To the agency’s credit it says so, and says what it intends to do: it is "working towards removing these unavailable areas and providing depth data for all areas of flood risk", with an intention to publish every three months. That is a stated aim, not a current position. Where the data is missing today, depth from local modelling can still be requested through the Flood Map for Planning service in the usual way.
Using depth data in a flood risk assessment
The data supports screening and context. On its own it does not support design, and an assessment using it has to be clear about which job it is doing. Every relevant Environment Agency guidance page now carries the same instruction, and it applies squarely here: an assessment must appraise the suitability of the datasets it has used.
- Check whether depth data exists for the site. If the polygon reads "Unavailable", stop. The site needs either a Product 4 request or its own model, and no amount of interpretation will fill the gap.
- Read the depth against the right scenario. Defended and undefended answer different questions, and on the climate change layers you are reading a central fluvial allowance and an upper end tidal one in the same view.
- Convert depth to level using your own survey. A band means nothing until it is set against measured site levels, because depth is reported above ground rather than to datum.
- State the band, not a point value. A 300 to 600mm band is not a 450mm design depth, and writing it up as one misrepresents the source.
- Escalate where the band is too coarse or the stakes are too high. Anything above 1200mm, and anything driving a floor level or a safe access route, wants modelled depths rather than banded national ones.
Functional floodplain deserves its own note, because the temptation to shortcut it will be strong. The product description states that the 3.3% dataset "does not replace the functional floodplain (FZ3b) which remains the responsibility of LPAs to designate in their strategic flood risk assessments". Where a strategic flood risk assessment is silent or out of date, the present-day 3.3% product can help establish the likely presence or absence of functional floodplain, and the depths add a dimension the extents alone never could. The climate change version cannot do that job, and the guidance closes the door on it explicitly: an authority may assess how climate change affects the future extent of its functional floodplain, but the result "should not be included in your functional floodplain designation". Sensitivity material, then, and nothing more. Our guide to Flood Zones 1, 2 and 3 sets out how 3b is designated.
Requesting depth data for a specific site
All four datasets sit on the Defra Data Services Platform rather than the Flood Map for Planning, so a case officer opening the planning map will not see them. Each is available as a web feature service, an OGC API endpoint and a file download. Use the live services rather than a stored copy: the agency intends to update quarterly, and a download taken today will be stale by the winter. For a quick first look at what is mapped at a postcode, our free flood risk map checker is the faster starting point.
Where depth data is unavailable, or the banding is too coarse for what an assessment has to prove, the route is a detailed model. If you need modelled depths, levels and velocities for a particular site rather than a national screening band, and especially if you are working somewhere the new layers return nothing at all, our team can advise on site-specific flood modelling or prepare a full flood risk assessment, and will turn a quote around within the hour.
Frequently asked questions
Does the new depth data change my site's flood zone?
No. The Flood Zones are unchanged by this release. These are supporting datasets published alongside the existing mapping, adding depth information to extents that were already there, so a site's zone is unaffected.
Does depth data remove the need for a topographical survey?
No, and if anything it makes one more necessary. The bands describe depth above ground level, so they cannot be turned into a flood level or compared against a door threshold without measured site levels.
Does this data cover Wales?
No. The datasets cover England only. Flood risk in Wales is assessed under TAN15 through a flood consequence assessment using Natural Resources Wales mapping, and this release does not apply there.
About the author. Freya is a Flood Risk Consultant focused on planning (NPPF/TAN15), insurance and property. Unda has been trading since 2014, is a CIWEM Business Partner with CIWEM member and chartered (C.WEM MCIWEM) consultants, and has delivered 5,000+ flood risk assessments and drainage strategies across England and Wales.
Freya Pott · MSc, BSc (Hons), GradCIWEM
Latest news



One of our experienced Flood Risk Consultants will get back to you within 60 minutes
