Surface Water Flood Risk in England’s Towns and Cities: What the Data Now Shows
Estimated reading time 13 minutes
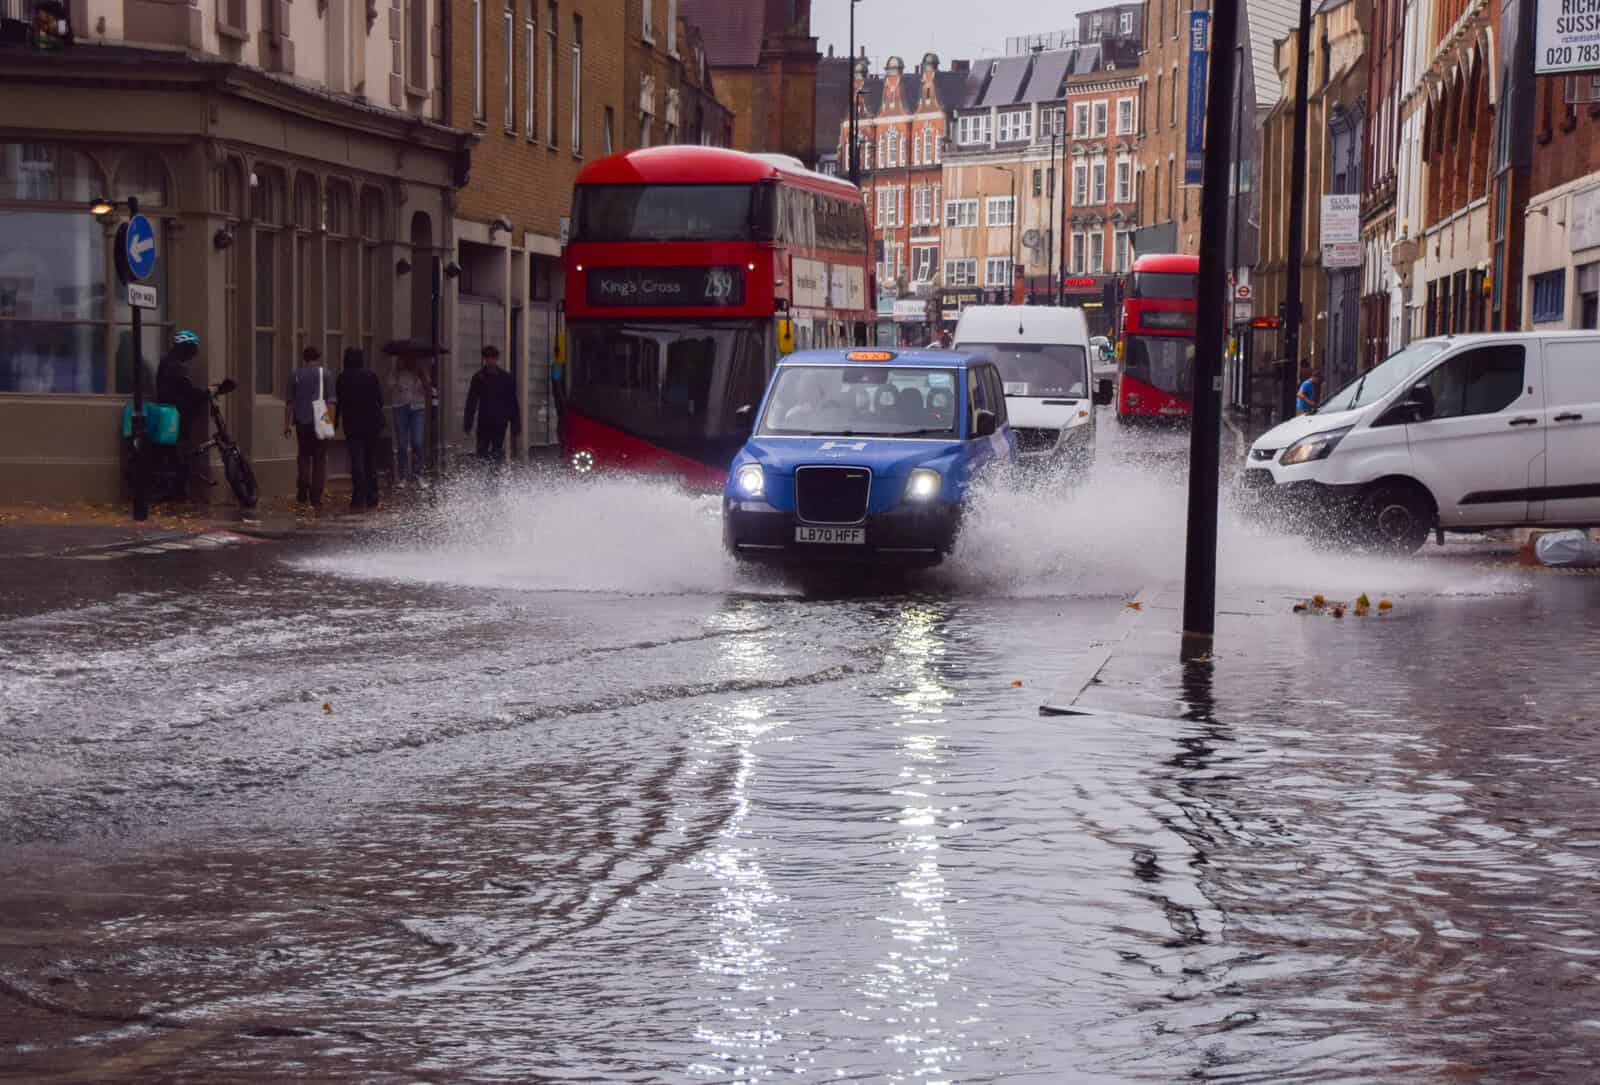
Surface water flood risk has become the defining flood problem in England's towns and cities. New national data shows that most homes now judged to be at high flood risk are urban, and the cause is rarely a river bursting its banks. It is rainfall that cannot drain away quickly enough. The Environment Agency's latest National Assessment of Flood Risk (NaFRA2), reflected in its Risk of Flooding from Surface Water (RoFSW) map, puts 4.6 million English properties in areas at risk of surface water flooding, and analysis by the National Housing Federation finds that eight in ten homes at high flood risk are in built-up areas. For anyone developing, buying or insuring urban property, that shift changes where the real risk sits. This page was last reviewed in August 2026 against the Environment Agency's current surface water flood risk data.
Around 839,000 urban homes in England are now at high risk of surface water flooding: at least a one in thirty chance of flooding in any given year.
What surface water flood risk means
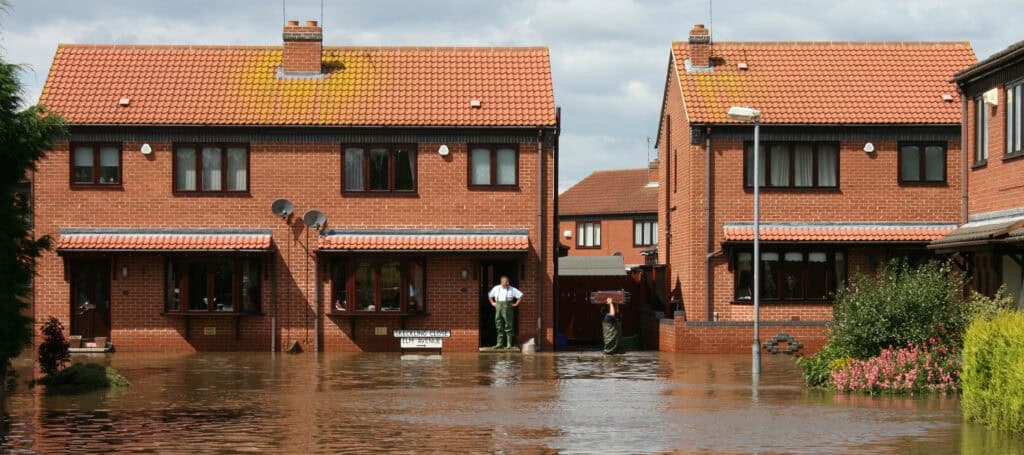
Surface water flood risk, sometimes called pluvial flood risk, is the chance that rainfall overwhelms the ground and the drainage before it can soak away, run off or be stored, so water flows across streets and pools in low ground. It is a different thing from river (fluvial) and coastal flooding, and it often affects places that sit outside the Environment Agency's mapped Flood Zones.
Put simply, surface water flood risk is the chance that heavy rain overwhelms the ground and the drains before it can drain away, so water runs across streets and collects in low ground, often well outside the mapped river and coastal Flood Zones.
That last point is what makes it awkward. Flood Zones are built around rivers and the sea, so a property can sit in Flood Zone 1, the lowest-risk category, and still take on water in a heavy storm because of where it sits in the local landscape. The table below sets out how surface water behaves differently from the two other main sources of flooding.
| Feature | Surface water (pluvial) flood risk | River and coastal (fluvial) flood risk | Groundwater flood risk |
|---|---|---|---|
| Where it occurs | Anywhere rain collects faster than it drains: streets, car parks, gardens, low ground | Along watercourses, floodplains and the coast | Low-lying areas over permeable rock, such as chalk and limestone; often emerges through floors and basements |
| Shown on Flood Zones? | Largely not; can affect land mapped as Flood Zone 1 | Yes; it is the basis of Flood Zones 2 and 3 | No; covered by a separate groundwater susceptibility dataset, not the Flood Zones |
| Main driver | Rainfall intensity, drainage capacity, hard surfacing | River flows, tides and the condition of defences | Prolonged wet weather raising the water table, and the underlying geology |
| Predictability | Less predictable; depends on local levels and flow routes | Follows clearer corridors around watercourses | Slow to arrive and slow to clear; can persist for weeks and follows the geology |
| Typical depth | Often shallower; about one in six high-risk properties reach 30cm | More often deeper; over two in five reach 30cm or more | Variable; frequently affects cellars and basements first |
If the vocabulary is unfamiliar, our explainer on what pluvial (surface water) flooding is and the wider guide to the sources of flood risk both go a level deeper.
How much of England's flood risk is now urban?
Most of it. The National Housing Federation's analysis of Environment Agency data found that eight in ten homes at high flood risk, about 839,000, are in towns and cities, and that there are now four times more properties at risk from surface water than from rivers and the sea. In the ten worst-affected urban constituencies, an average of one in four households is in social housing, against one in six nationally.
The concentration is stark in particular seats. Reporting of the analysis, in the Guardian, put Thurrock, South Basildon and East Thurrock, Bootle, Sefton Central and Southport among the most exposed, with parts of London, including Hackney, Barking and Tottenham, also prominent. In the worst-affected constituencies, between 15% and 29% of homes sit in high flood-risk areas. Those are places where dense housing, older drainage and limited green space tend to sit together, and where the households affected are often the least able to absorb the cost: only around one in three of England's poorest households hold contents insurance, against nine in ten homeowners.
Across England, about 6.3 million properties, one in four, are now at some risk of flooding, and the Environment Agency expects that to approach 8 million by the 2050s.
This is national modelled data, and it needs reading with care rather than as a simple yes or no. It is the right tool for understanding where risk is concentrated, which is what the NaFRA2 assessment was built to do, but it is a starting point for any single property, not the last word.
Why surface water now drives urban flood risk
Three pressures have converged. Rainfall is becoming more intense, more urban land is covered by hard surfaces that shed water instead of holding it, and drainage networks built for a gentler climate and a smaller population are being asked to carry more than they were designed for. Better modelling of the Risk of Flooding from Surface Water has then revealed risk that was always there but under-recorded.
- Heavier rainfall. More intense storms drop more water in less time, so drainage that once coped is overwhelmed more often. We cover this in how increasing rainfall is changing flood risk in the UK.
- More hard surface. Roofs, roads, driveways and paving stop water soaking into the ground and push it straight into drains and across the surface. The domestic version of this is set out in why paved gardens threaten urban flood resilience.
- Ageing drainage. Much of the urban network was sized for a different climate and a lower density, and cannot expand as quickly as the pressure on it grows.
- Less storage and green space. As towns and cities fill in, the soft ground and open space that once absorbed and slowed rainfall shrinks, so there is nowhere for water to go.
Why have the mapped numbers risen?
Partly because the risk is genuinely growing, and partly because we can now see it better. When the Environment Agency published its second National Assessment of Flood Risk in December 2024, its surface water flood risk figure rose by 43% on the previous assessment, from 3.2 million to 4.6 million properties. The Agency was clear that the jump was largely about method rather than a sudden change on the ground.
These increases are almost entirely due to significant improvements in our data, modelling and use of technology.
Environment Agency, National Assessment of Flood Risk, December 2024
Better terrain data, improved surface water modelling and the inclusion of smaller watercourses have all revealed exposure that older maps understated. The picture kept moving into 2026: from 28 May the Flood Map for Planning added surface water climate change extents, which we unpack in the May 2026 Flood Map for Planning update. None of this makes the risk less real. It means the numbers are catching up with it, which is also why a mapped figure is worth interpreting rather than taking at face value.
Surface water flood risk is really a drainage problem
In towns and cities, surface water flood risk is governed less by major flood defences and more by how well drainage performs. If rainfall cannot be stored, slowed, infiltrated or safely routed, it has to go somewhere, and in dense areas that usually means streets, basements, car parks and low-lying buildings.
A site can sit outside every mapped river Flood Zone and still be at real risk if intense rainfall has nowhere to go.
That reframes the problem as a design question. Flooding happens when drainage networks lack capacity, when new development increases run-off, when exceedance routes are blocked, or when surface water is redirected without enough thought. The scale of the underlying issue is set out in our piece on the UK's drainage problem and the case for source control, and the practical mechanics, from how foul, surface and combined sewers differ to the SuDS hierarchy that governs how run-off should be managed, sit behind almost every urban case.
What surface water flood risk means for urban development
For developers and landowners, flood risk is no longer just the mapped Flood Zone. Surface water risk turns on local ground levels, overland flow routes, existing drainage capacity, how much hard surface a scheme adds, and how it stores and discharges water. These are design questions, and they are far cheaper to answer early than to retrofit once a layout is fixed.
- Screen every source at the outset, surface water included, rather than clearing a site on its Flood Zone alone.
- Establish levels and flow routes so you know where water enters, crosses and leaves the site before you commit to a layout.
- Design drainage against the current standards from the start, sizing storage and discharge to the 2025 national SuDS standards and the surface water drainage strategy the authority will expect.
- Submit enough drainage detail to satisfy the Lead Local Flood Authority, because thin information at submission is a common cause of objections and cannot always be tidied up later through condition discharge.
Policy has moved in the same direction. Surface water now has to be weighed alongside river and coastal risk in planning decisions, a shift covered in full in our guide to surface water flooding and planning. Get it wrong and a scheme can stall; get it right early and it usually becomes a manageable part of the design.
What it means if you are buying or insuring an urban home
If you are buying an urban property, a high surface water flood risk flag on a national dataset is a prompt to look closer, not a verdict. It needs interpreting against the specific property: its levels, its history, and how water actually moves around it. A flood risk survey for a property purchase exists to establish whether a mapped risk is real and what it means for that particular home.
For insurance, the same national data can drive premiums or terms that do not reflect the risk on the ground, and a flood risk assessment for insurance purposes is often about clarifying or challenging those assumptions with site-specific evidence.
Only around one in three of England's poorest households hold contents insurance, against nine in ten homeowners, so the places most exposed to surface water are often the least protected.
In a surface water flood risk zone?
Whether it is for planning, a purchase or your insurer, our consultants turn a mapped surface water flood risk flag into a clear, site-specific answer, and one of them will come back to you within the hour.
Start a quoteSurface water flood risk rewards early, specific input, not because every mapped risk is critical, but because urban flooding depends so heavily on local conditions that have to be understood before decisions are made. If you need that risk assessed properly, our flood risk assessments for planning do exactly that, and one of our consultants will come back to you within the hour.
Frequently asked questions
What is a surface water flood risk?
Surface water flood risk, also called pluvial flood risk, is the chance that heavy rainfall overwhelms the ground and the drainage before it can soak away, so water flows across streets and collects in low ground. It is measured by the Environment Agency's Risk of Flooding from Surface Water (RoFSW) map and, unlike river and coastal risk, it can affect properties well outside the mapped Flood Zones. Around 4.6 million English properties now sit in a surface water flood risk area.
How do I check the surface water flood risk for a specific property or postcode?
Start with the government's free check the long term flood risk service and the Environment Agency's Flood Map for Planning, both of which show surface water risk by location. They give a national screen, not a property-specific answer, so a high or medium flag is a reason to get the site looked at rather than a final judgement.
Should I buy a house at risk of surface water flooding?
Not necessarily a dealbreaker, but not something to wave through either. National maps can overstate or understate the risk at a single address, so the sensible step is a property-specific assessment that checks the levels, the flood history and how water moves around the building, so you know what you are taking on and how it can be managed. Our flood risk survey for a property purchase is built for exactly this.
Does risk of surface water flooding affect insurance?
It can. Insurers lean on national flood datasets, and a high surface water flood risk flag can raise premiums or narrow cover, even where the risk to the specific building is lower than the map suggests. A site-specific flood risk assessment for insurance purposes is often what clarifies or challenges those terms with real evidence.
How to deal with surface water flooding?
On a site or a development, the answer is drainage design: sustainable drainage that stores, slows and infiltrates rainfall, sensible level design, and protected overland flow routes so water has a safe path when the drains are full. For an existing home, property flood resilience measures, keeping gullies and drains clear, and avoiding extra hard surfacing all help. The gain is largest when surface water is designed for from the start rather than added at the end.
Who is responsible for managing surface water flooding?
No single body. Lead Local Flood Authorities lead on surface water and local flood risk, but they sit alongside water companies, highways authorities and the Environment Agency, with responsibilities that overlap. Our explainer on the Lead Local Flood Authority sets out who does what.
Does surface water flooding affect a mortgage?
It can. Lenders take flood risk into account, and a high mapped risk with no supporting assessment can complicate an application. A clear, site-specific view of the actual risk, as covered in flood risk and mortgage lending, is usually what resolves it.
About the author. Edward is a co-founder and Director of Unda with 20+ years in flood risk and drainage, and a national-press commentator on flooding. Unda has been trading since 2014, is a CIWEM Business Partner with CIWEM member and chartered (C.WEM MCIWEM) consultants, and has delivered 5,000+ flood risk assessments and drainage strategies across England and Wales.
Edward Bouët · BSc (Hons)
Latest news



One of our experienced Flood Risk Consultants will get back to you within 60 minutes
