The British Geological Survey explained: what BGS data tells you about a site
Estimated reading time 16 minutes
The British Geological Survey is the UK's national geological survey and the public custodian of its geoscience records: a research centre of the Natural Environment Research Council, founded in 1835, holding the national geological map and more than a million borehole logs. For anyone who wants to know what lies beneath a piece of land, it is the free evidence base, and most of it opens in a browser.
What follows is what the organisation is, what it holds, how to read the maps and the borehole logs, and what the licensed parts cost. The last two sections are narrower: how the data is used in a flood risk assessment for planning or a surface water drainage strategy, and where a national dataset stops being evidence.
Over a million borehole, shaft and well records sit in the national archive, around 850,000 of them scanned and free to view online.
What is the British Geological Survey?
The British Geological Survey is a research centre of the Natural Environment Research Council, part of UK Research and Innovation, and the body responsible for mapping the geology of Great Britain and keeping the national geoscience archive. It was founded in 1835 and is the world's oldest national geological survey. It advises government, industry and academia, but it regulates nothing and approves nothing. Nothing it publishes is a consent.
Annual turnover runs at roughly £55 million, about half from UKRI-NERC National Capability funding and the balance from commissioned work for public and private clients. Headquarters are at Keyworth in Nottinghamshire, with further centres at Edinburgh, Wallingford and Cardiff.
Two things follow from that status. The first is custodianship: two centuries of borehole logs, site investigation reports and mine records have been deposited with the BGS and are held in the National Geoscience Data Centre. The second is standing: because BGS mapping is the national baseline and not a commercial product, it is the version of the geology that a planning authority, a regulator and a consultant are all working from, which removes one argument before it starts.
What data does the BGS hold?
The archive is the part most people underestimate. The Single Onshore Borehole Index holds over a million records of boreholes, shafts and wells across Great Britain onshore and near-shore, dating back to at least 1790 and ranging from one metre to several thousand metres deep. Thousands more are added every year.
Sitting on top of that index is the scanned collection: around 850,000 records with roughly 50,000 added annually, most of them free to open. The National Well Record Collection adds more than 130,000 classified records of wells, boreholes and springs in England and Wales. Alongside the boreholes are published geological maps and sections going back to 1832, printed publications from 1835, historical mine plans, geochemical and geophysical survey data, and the 1:50,000 digital geology that underlies almost every ground desk study in the country.
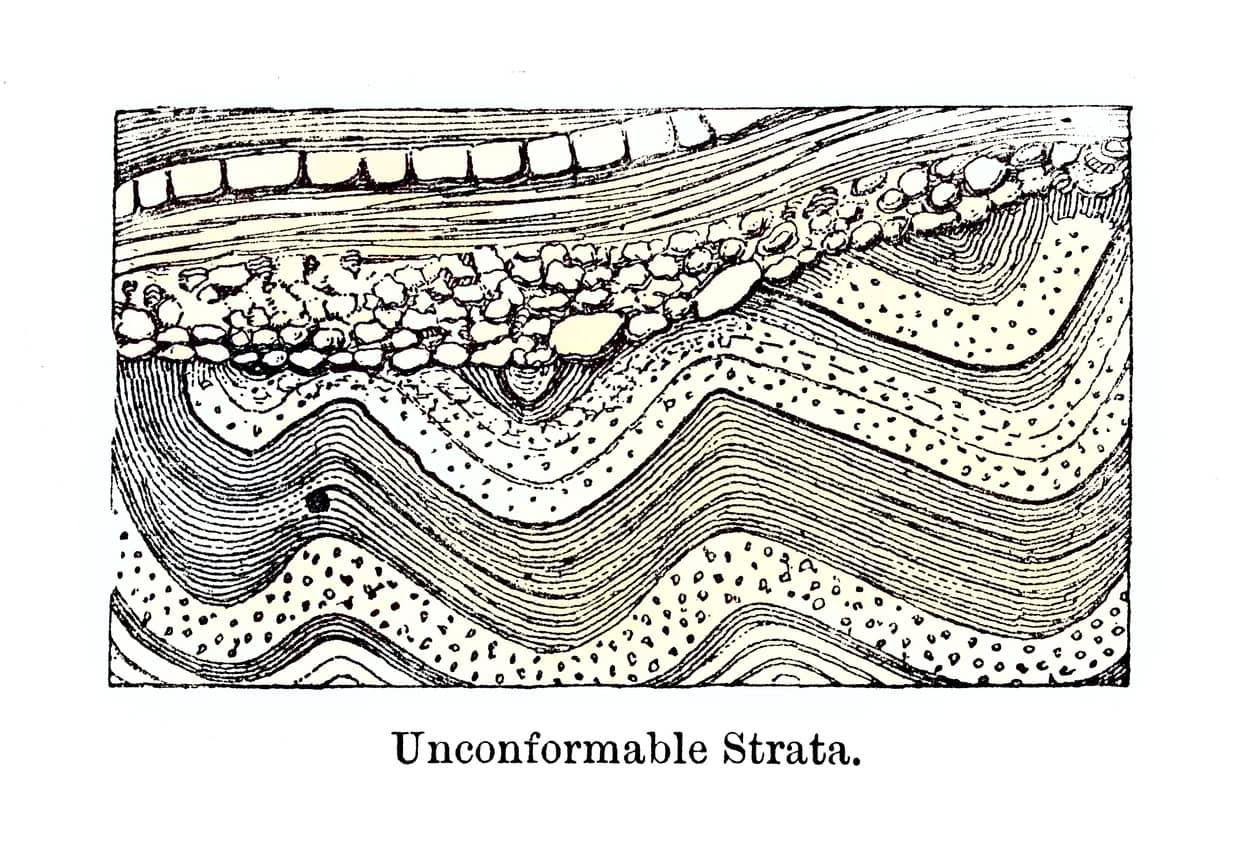
The scanned borehole collection grows by about 50,000 records a year, which means a site checked five years ago may have logs today that it did not have then.
What is the BGS GeoIndex map?
The GeoIndex is a map-based index of everything the BGS holds for a given point in Great Britain. It is a discovery tool first and a viewing tool second: the question it answers is what data exists here, not what the answer is here.
Zoom to a location and the viewer shows dots where boreholes were sunk, outlines where mine plans survive, and footprints where three-dimensional models exist. The density varies enormously. Some of those records open on the spot, free; others simply confirm that a record exists and can be requested. Alongside the index sit interpreted layers that can be read straight off the screen, including 1:50,000 bedrock and superficial geology with faults, hazard layers, hydrogeology, and interactive subsurface models for London, Cardiff, Glasgow and Liverpool with borehole, cross-section and depth-slice tools.
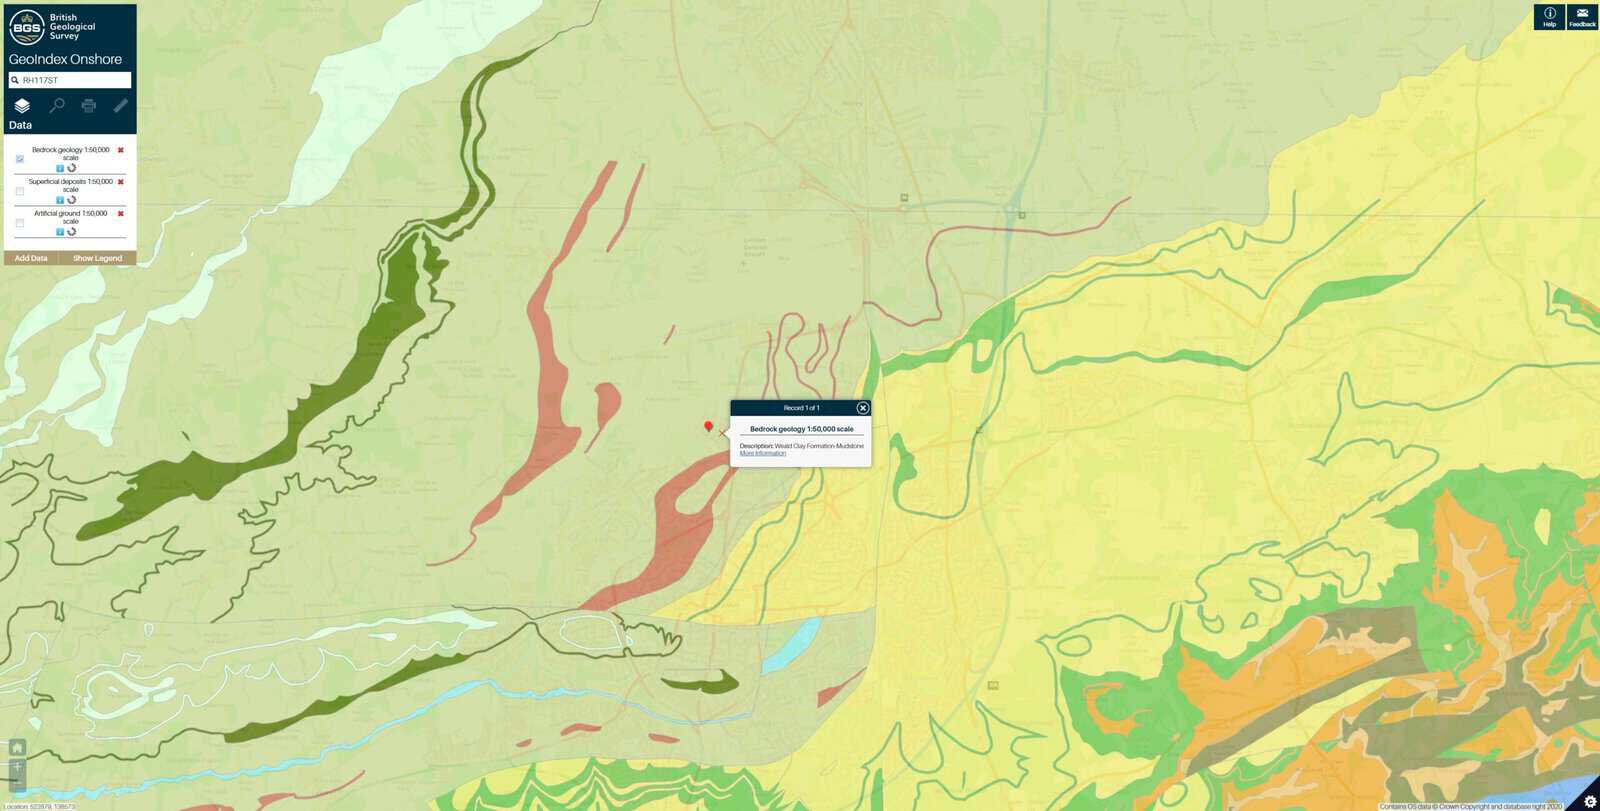
The panel on the left is a desk study in miniature: bedrock geology, superficial deposits and artificial ground, each at 1:50,000, each switched on or off on its own. A click on the map returns the mapped unit at that point, here a mudstone.
Practically, the viewer supports rectangle, polygon and circle searches, distance and area measurement, PDF report generation, and clip-and-download of data to a shape or an uploaded shapefile. The whole of it runs under the Open Government Licence, which requires the line Contains British Geological Survey materials © UKRI [year] wherever the mapping is reproduced. For repeat use the GeoIndex web map services are the better route, loading BGS layers live into QGIS or ArcGIS alongside other national datasets such as LiDAR.
What do the GeoIndex geology layers show?
The mapped geology is layered the way the ground is. At the base is bedrock, the solid rock. Above it sit superficial deposits, the younger loose materials left by ice, rivers and the sea. At the surface there may be artificial or made ground, where people have filled, dug or re-graded the land. A borehole drilled at one point cuts through all three and records what is actually there. Maps infer; logs measure.
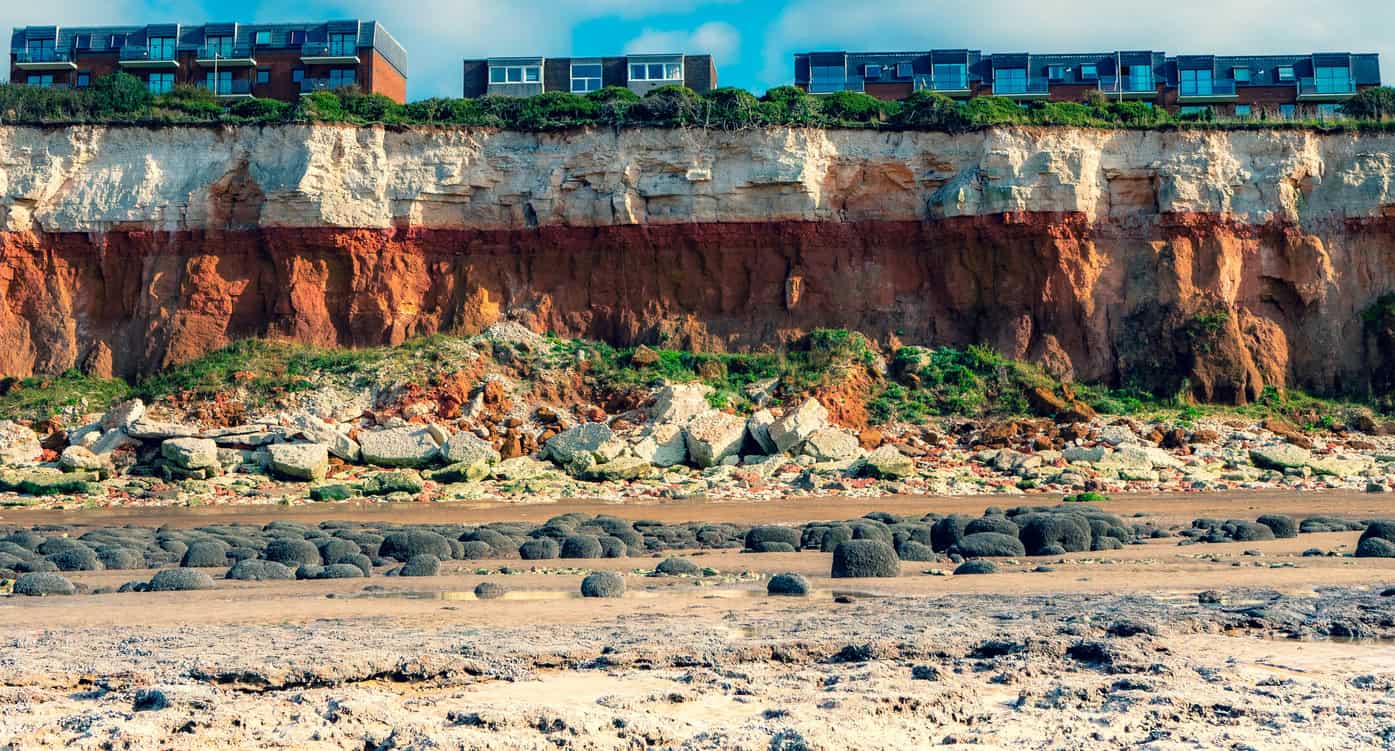
Most sites offer nothing so obliging. The same three layers are there, but inland they have to be assembled from mapping and borehole logs rather than read off a face.
The viewer carries far more than a ground desk study needs. Eight layers do most of the work.
| Layer | What it shows | What it tells you about the ground |
|---|---|---|
| Bedrock | Solid geology beneath any superficial cover | The rock a deep excavation reaches, and the long-term aquifer |
| Superficial deposits | Alluvium, river terrace gravels, head, till, brickearth | The loose cover the first few metres of any excavation sit in |
| Artificial ground | Made, worked, infilled and landscaped ground | Where people have filled, dug or re-graded the land |
| Mass movement | Mapped landslip deposits | Ground that has moved before |
| Linear features | Faults and structural lines | Breaks in the rock that water and movement follow |
| Borehole records | Scanned logs, water wells, site investigation reports | A measured profile at a point, rather than a mapped inference |
| Landslides | The National Landslide Database | Recorded instability events, separate from mapped deposits |
| Hydrogeology | Aquifer potential at 1:625,000 | A coarse national view of which rocks hold and yield water |
Two of those come with a caution. The hydrogeology layer is generalised at 1:625,000, an order of magnitude coarser than the geology, so it orients; it does not answer. And artificial ground mapping is incomplete by nature, so a clean artificial ground layer proves nothing about what is actually under the topsoil, because a sheet surveyed decades ago records the fill that existed then and none of what has been tipped, levelled or built over since.
How do you read a BGS borehole record?
A borehole record is the closest thing to free site data anyone gets. Most logs carry strata descriptions with depths, the drilling method and date, a ground level, and water strikes recorded as struck and rest levels. Three or four logs around a site build a usable picture of the ground before anyone mobilises a rig.
- Zoom in far enough. The scanned records layer only draws at map scales below 1:174,000, which is why a location can look as though it has no records at all until the viewer is zoomed right in.
- Open the nearest logs. Note the BGS reference, the distance and direction from the site, and the date the hole was drilled. All three matter when the log is quoted later.
- Read the strata down the log. Record where artificial ground stops, how thick the superficial deposits are, and at what depth the bedrock is proved.
- Take both water levels. The struck level is where water was first met; the rest level is where it settled after the hole had stood, which in a low-permeability stratum can take considerably longer than the driller was on site for. They are rarely the same number. The date matters as much as the depth.
- Compare against the map. A log showing clay where the map shows sand is a warning that the polygon boundary is wrong locally.
Two quirks in the records
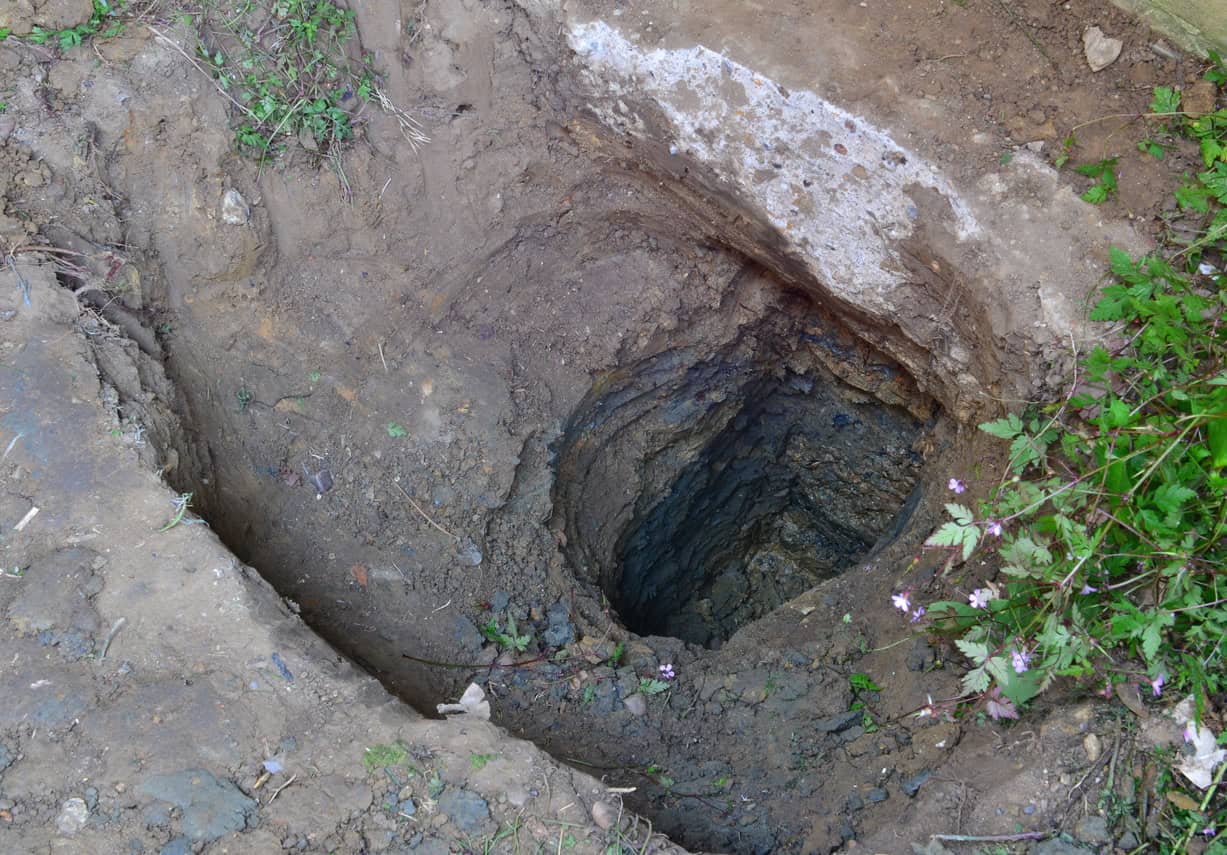
A depth shown as -1 marks a confidential borehole, restricted for commercial or sensitivity reasons and released only with written authorisation from whoever deposited it. A depth of 0 simply means the value has not been databased.
Coverage is also heavily biased towards urban areas, infrastructure corridors and former industrial land, so open countryside may have nothing within a kilometre.
A summer rest water level in a 1970s log is a data point, not a design groundwater level. The winter maximum is the figure anything built below ground has to clear.
What does BGS data cost?
Most of what a desk study needs is free. The Open Government Licence covers it. The derived datasets built for engineering and drainage decisions are not, and the boundary between the two decides how BGS material can appear in a deliverable.
| Product | What it gives | Cost |
|---|---|---|
| GeoIndex, borehole scans, geology viewer, web map services | The index, the scans and the 1:50,000 mapping | Free under the Open Government Licence |
| Infiltration SuDS Map, detailed | 20+ layers including soluble rocks, collapsible ground, shrink-swell clays and pollutant attenuation | £1.71 per km² |
| Infiltration SuDS Map, summary | Four layers: constraints, drainage potential, ground instability, groundwater contamination | £0.58 per km² |
| GeoSure | Six ground movement themes at 1:50,000 | £0.06 to £0.91 per km² by theme |
| Infiltration SuDS GeoReport | A compiled report covering about 2 km² around a point, delivered in two working days | £96 including VAT |
The per-square-kilometre rates are not the whole cost: licence fees, user numbers and data preparation charges sit on top. For a single small site the GeoReport is cheaper than licensing the dataset behind it. For anyone running many sites a year the arithmetic reverses, and the licence also produces data that can be clipped, styled into a figure and dropped into a report, which a fixed PDF cannot.
The free tier is free for commercial use, including work a client pays for, provided the attribution line appears. Redistributing a licensed dataset, or embedding it in a deliverable a client can extract, needs the commercial licence instead.
How BGS data is used in flood risk and drainage work
Everything above applies to anyone looking up the ground beneath a plot. This section is narrower, and covers how the same free layers are used in England and Wales once a scheme needs planning permission, at the point where they stop being general interest and become the evidence a lead local flood authority reads before deciding whether a drainage strategy is credible.
Policy F8 of the August 2026 NPPF makes design to the 2025 National Standards for Sustainable Drainage Systems mandatory, and the SuDS hierarchy those standards apply sends surface water into the ground first. Infiltration therefore has to be considered on every site, which is why a drainage strategy opens the geology before it opens anything else.
- Infiltration feasibility. Granular superficial deposits over permeable bedrock point one way; glacial till or clay with no superficial cover points the other.
- Depth of loose cover. A mapped river terrace gravel behaves very differently at 1 m thick and at 6 m thick, and a nearby borehole is often the only free way to tell.
- Artificial ground. Mapped fill is a warning on infiltration, on foundations and on contamination pathways at once.
- Likely groundwater depth. Struck and rest levels in old logs bracket what groundwater monitoring will later measure properly.
- Geohazards. Dissolution, landslip and shallow mining each remove infiltration from the table before any test is booked.
- Floodplain corroboration. Mapped alluvium often traces the historic floodplain more faithfully than a modelled outline does.
A soakaway that works on paper and fails on site has usually failed on something the mapping could not show: unrecorded fill in the top two metres.
Two national datasets sit alongside the BGS layers, not inside them. Groundwater protection is governed by the Environment Agency's aquifer designations and source protection zones, which a consultee will expect to see cited in preference to the coarse BGS hydrogeology layer. Groundwater flood risk is screened from the BGS susceptibility mapping, which is a separate licensed product with its own caveats. For the infiltration question alone, Unda's free ground conditions and geology checker reads the same 1:50,000 mapping under any postcode and gives an indicative read on whether a soakaway is likely to work.
Where BGS data stops being evidence
Every dataset described above is national, generalised and modelled to some degree, and the BGS says so itself. The Infiltration SuDS Map is published as a preliminary screening rather than a replacement for site investigation, and the free viewer data comes with an explicit disclaimer.
The BGS provides no warranty as to the quality, accuracy or completeness of this free map data.
British Geological Survey · GeoIndex terms of use
Three limits recur in practice. The first is scale: at 1:50,000 a millimetre on the published map is 50 m on the ground, so a polygon boundary is an indication, not a survey line, and a site near the edge of a superficial deposit can sit in either unit. The second is the difference between susceptibility and probability; a susceptibility class describes geological conditions, not the chance of something happening in a given year. The third is the weathered surface layer. Chalk beneath clay-with-flints, or weathered mudstone, behaves nothing like the mapped bedrock in the first three metres, and that is exactly the depth most excavations work in.
That matters because planning practice guidance requires a flood risk assessment to consider flooding from every source, including rising groundwater, and a screening class is not an assessment of any of them.
None of which reduces the value of the data. It sets how it is cited: as mapped evidence, with its scale and the date accessed stated, alongside borehole records identified by reference, distance and date. The CIRIA C753 infiltration assessment checklist identifies the BGS Infiltration SuDS Map as the preliminary source for constraints, infiltration potential, ground instability and groundwater quality, and then requires testing to BRE Digest 365 and maximum likely groundwater more than 1 m below the base of the device, leaving a genuine unsaturated zone underneath it. Screening scopes the investigation. It never replaces it.
Where a desk study points one way and a scheme depends on it going the other, the honest next step is measurement: a soakage test, or groundwater monitoring across a wet season. Unda's consultants read the national datasets, scope the testing that follows and produce flood risk assessments and drainage strategies that hold up in front of a lead local flood authority. Call +44 (0) 1293 214444 or email enquiries@unda.co.uk and a consultant will look at a specific site.
Frequently asked questions
Can BGS maps be used in a report a client pays for?
Yes, for anything published under the Open Government Licence, which covers the GeoIndex, the borehole scans, the geology viewer and the web map services. The condition is attribution: the line Contains British Geological Survey materials © UKRI [year] has to appear wherever the mapping is reproduced. Licensed products such as GeoSure and the Infiltration SuDS Map are different, and redistributing those, or embedding them where a client can extract them, needs the commercial licence.
Does the British Geological Survey cover Northern Ireland?
No. The BGS maps Great Britain, meaning England, Scotland and Wales. Northern Ireland is covered by the Geological Survey of Northern Ireland, which runs its own GeoIndex and its own 1:50,000 mapping. A desk study for a site in Northern Ireland uses GSNI, not the BGS viewer, and the two are not interchangeable.
How old is BGS geological mapping?
It varies enormously by sheet. The published map series runs from 1832, and while the digital 1:50,000 data is maintained, the underlying survey for a given area may be decades old and was carried out for geological rather than engineering purposes. A sheet last surveyed in the 1960s will not show development that has since raised or filled the ground, which is one more reason mapped artificial ground is a floor and not a ceiling.
What is the difference between the British Geological Survey and the Environment Agency?
The BGS maps the ground and keeps the geoscience archive; it is a research body with no regulatory role. The Environment Agency regulates, publishes the Flood Map for Planning and the surface water risk map, designates aquifers and source protection zones, and is a statutory consultee on planning applications. A flood risk assessment normally cites both: the Agency for flood extents and groundwater protection, the BGS for what the ground is made of.
Why can I not see any boreholes near my site?
Usually the map is not zoomed in far enough, since the scanned records layer only draws below 1:174,000. If records still do not appear, the site is probably in an area with little recorded drilling. Coverage follows development, so towns, motorways, railways and former industrial land are dense with logs while open countryside can be empty for a kilometre or more. No records does not mean no ground information. It means the picture has to be built from the mapping first, and from site investigation after that.
About the author. Emma is a Senior Flood Risk Consultant, and a policy and flood modelling expert. Unda has been trading since 2014, is a CIWEM Business Partner with CIWEM member and chartered (C.WEM MCIWEM) consultants, and has delivered 5,000+ flood risk assessments and drainage strategies across England and Wales.
Emma Jeffery · MSci (Hons)
Latest news


One of our experienced Flood Risk Consultants will get back to you within 60 minutes