LiDAR Data in the UK: A Complete Guide for Flood Risk and Drainage
Estimated reading time 23 minutes
LiDAR data in the UK is free, national in coverage, and more widely misunderstood than any other dataset in flood risk assessment and drainage strategy practice. The Environment Agency publishes elevation models covering roughly 99% of England under the Open Government Licence, Wales has near-complete 1 m coverage of its own, and any consultant, planner or developer can download a 5 km tile in about a minute. What nobody publishes alongside it is the part that decides whether the data will carry a decision: how old it is, how accurate it really is, and which parts of the surface were measured and which were invented.
This guide sets out what the UK publishes, which dataset to download for which job, how to establish when a particular site was last flown, and where free elevation data stops being sufficient evidence.
No Environment Agency LiDAR has been flown and published anywhere in England since 18 April 2024, and the agency has confirmed in writing that no rolling national refresh is planned.
What is LiDAR data, and what does the UK publish?
LiDAR, or light detection and ranging, measures ground elevation by timing laser pulses fired from an aircraft to the surface and back. In the UK the resulting elevation models are published free by the Environment Agency for England, by the Welsh Government and Natural Resources Wales for Wales, and by the Scottish Remote Sensing Portal for parts of Scotland. All are gridded rasters of bare-earth topography referenced to Ordnance Datum Newlyn, and all are supplied as elevation values rather than as pictures.
England's holdings come from three separate families. Confusing them is the commonest error a first-time user makes. The National LiDAR Programme was the flying campaign: the Environment Agency divided England into 302 survey blocks in 2017 and captured them during winter months between January 2017 and February 2023. The LiDAR Composite is a merged product built from those surveys plus the older archive. The Time Stamped Tiles are the raw archive itself, every individual survey since 1998, held separately so that the capture date of each is preserved.
| Dataset | Resolution | Coverage | What it is for |
|---|---|---|---|
| LiDAR Composite DTM and DSM | 1 m and 2 m | ~99% of England | The default working surface for desk study and catchment-scale analysis |
| National LiDAR Programme DTM, DSM and point cloud | 1 m | All England, Phase 1 | Consistent recent capture where the composite would otherwise draw on older data |
| Time Stamped Tiles | 25 cm to 2 m | England, 1998 onwards | Establishing what was flown over a site, and when |
| LiDAR point cloud | Discrete returns | England | Reclassification, custom filtering and bare-earth work |
| Vertical Aerial Photography | 10–50 cm | England | Visual context and feature identification |
Everything above downloads from the Defra Survey Data Download service under the Open Government Licence v3.0. The practical constraint is tile size: public users take one 5 km tile at a time, and anything larger needs a Large Data Request.
Elevation data is where most site work starts, and where a planning submission is most easily undermined. Ground levels decide whether a site sits above or below a design flood level, whether safe access can be demonstrated, and whether the Flood Zone shown on the Flood Map for Planning reflects the site as it stands. Those are the questions a flood risk assessment for planning has to answer with evidence, and free LiDAR is where the evidence begins rather than where it ends. At the earliest stage it is also what a flood risk feasibility study works from before any site survey is commissioned.
Which LiDAR dataset do you actually need?
For most desk-based flood risk and drainage work the 1 m LiDAR Composite DTM is the right starting point: it has the widest coverage, the best available resolution merged in, and no gaps. Move to the National LiDAR Programme where the composite draws on older surveys, and to the Time Stamped archive whenever the date of capture matters to the argument being made.
- Composite DTM 1 m. The default. Best available data merged into a continuous surface, resampled where necessary. Use it for catchment delineation, overland flow routing, and locating the discharge points that each tier of the SuDS hierarchy depends on.
- National LiDAR Programme. A single consistent capture per block, flown leaf-off between 2017 and 2023. Use it where the composite would otherwise pull in twenty-year-old data, and where a uniform vintage across a site boundary matters.
- Time Stamped Tiles. Individual surveys with their capture dates intact, including the 25 cm and 50 cm resolutions the composite no longer offers. Use it to establish provenance and to find the highest-resolution capture available.
- Point cloud. The classified returns themselves, in LAZ format. Use it where the Environment Agency's automated ground classification has failed and the surface needs rebuilding.
A caution on the fine resolutions. The Environment Agency retired the 25 cm and 50 cm composite products; its own record states that the team no longer produces a 25 cm composite and that it has been replaced by a 1 m version. Data at those resolutions still exists inside the Time Stamped archive for individual historic surveys, but a specification written today asking for a 25 cm composite is asking for a product that no longer exists.
A single 5 km composite tile can contain cells flown 22 years apart, at different source resolutions, under different vertical transformation models.
How old is the LiDAR data over your site?
Older than almost anyone assumes. The 2022 LiDAR Composite contains surveys flown between 6 June 2000 and 2 April 2022, and nothing in the raster distinguishes a cell captured last decade from one captured this. The Environment Agency's survey index catalogues are the only way to establish, for a specific site, which survey the elevation came from and when it was flown.
The composite is not a survey. The Environment Agency states as much in its own metadata: it is a mosaic of surveys assembled in 2022, in which the newest and best-resolution data available was used wherever repeat coverage existed, and older data was left in place wherever repeat coverage did not exist.
The currency position is worse than the composite alone suggests. The National LiDAR Programme completed Phase 1 in February 2023, and the Environment Agency has since flown only selective repeat blocks. Its published position on what happens next is unambiguous.
There is not curretly a plan to capture all the origianl phase 1 survey blocks over a rolling programme with repeat surveys be based on the requirements for upto date elevation data for an area.
Environment Agency, National LiDAR Programme dataset record, last updated 12 September 2025 (spelling as published)
A direct query of the Environment Agency survey index on 18 September 2026 returned 1,466 survey tiles flown in 2024, and none at all for 2025 or 2026. The most recent published capture anywhere in England is dated 18 April 2024. Where ground levels have changed since then, whether stripped, regraded, filled or built out, the published elevation model describes a landscape that no longer exists. The model carries no warning that this is so.
- Open the Environment Agency's Metadata Survey Index Catalogues, published on the Defra Data Services Platform as downloadable index polygons and as WFS, WMS and OGC API Features endpoints.
- Load the index layer matching the product in use: the composite extents layer, the Time Stamped extents layer or the National LiDAR Programme index.
- Query the polygon covering the site. The sd_flown and ed_flown attributes give the start and end dates of the survey that produced the elevation at that location.
- Record those dates. On the Time Stamped index, also record the transform and geoid attributes, which state the vertical transformation applied to that tile.
- Compare the capture date against the site's own history, which is the levels step in any flood risk assessment. Any earthworks, development or watercourse works completed after that date are absent from the model.
Stating those dates is not a formal requirement. Government guidance on using modelling for flood risk assessments asks only that a modeller should "check the survey data is still valid for key areas and structures, if using old survey data". The same applies to the modelled levels obtained through an Environment Agency flood data request, which are only as current as the model behind them. Recording the flight dates is how that check is evidenced, and it is a straightforward way to show the terrain evidence has been interrogated. The same discipline belongs in the Model User Report that accompanies hydraulic modelling submitted under the Environment Agency's river modelling technical standards.
DTM, DSM and DEM: what each surface actually contains
A digital terrain model (DTM) is the bare ground, with buildings and vegetation removed. A digital surface model (DSM) is everything the laser struck, including roofs and canopy. DEM is the generic umbrella term covering both. In Environment Agency products the distinction is more specific than the general definitions suggest, and one detail in particular is worth knowing before downloading anything.
A single laser pulse can produce several returns as it passes through a tree: an early return from the canopy, later returns from branches, and a final return from the ground beneath. What the Environment Agency does with those returns determines which product you are looking at.
- Digital Terrain Model. Built from the last return classified as ground, with surface objects filtered out. The agency applies automated classification and then manual editing "to produce a most likely ground surface model", so the DTM is an interpreted product, not a raw measurement.
- Digital Surface Model. Built from "the last or only LIDAR pulse returned to the sensor", retaining ground and surface objects. Note the wording: the standard Environment Agency DSM is a last-return product.
- First Return Digital Surface Model. Published separately as FZ_DSM and built from the first or only pulse. This is the true canopy-top and building-edge surface, and it is what most people mean when they say DSM.
- Intensity Surface Model. A measure of how much laser light each pulse reflected. Darker surfaces such as roads return less than vegetation, which makes it useful for identifying surface types, not heights.
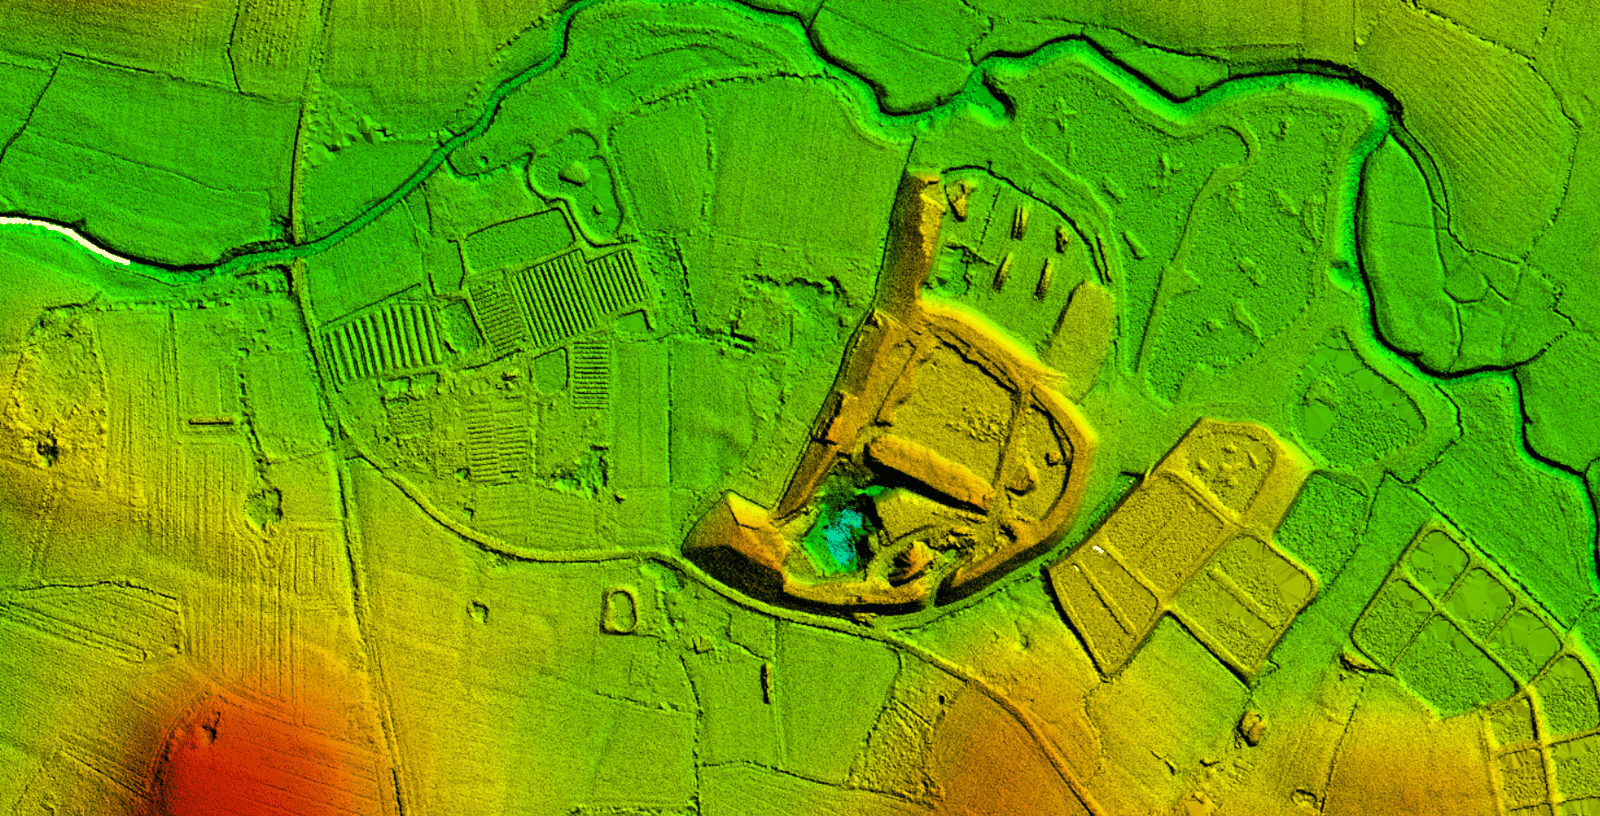
- Hillshade and other derived images. Not a published product. The familiar shaded-relief LiDAR images come from applying an illumination model to a DTM in GIS software, and they are a way of seeing the topography, never a substitute for the elevation values themselves.
A workflow that asks for canopy height or building massing and reaches for the product labelled DSM will therefore be working from the wrong surface. The correct product is FZ_DSM. Handling the distinction correctly is routine in GIS-based flood risk analysis, and getting it wrong is a quiet source of error in building-height and screening work.
How accurate is LiDAR data?
Environment Agency LiDAR is published with a stated vertical accuracy of plus or minus 15 cm RMSE. That figure is a quality-control acceptance threshold measured on flat hard standing. It is not a description of the accuracy achieved across a real site, and in vegetation, on slopes and around buildings the error is materially larger.
The 15 cm figure appears on every Environment Agency LiDAR record and is widely quoted as though it were a site accuracy. The agency's own technical note on ground truth surveys makes clear what it actually measures.
A ground truth survey is a collection of a few hundred points captured on a flat, unambiguous surface such as a tarmac car park or tennis court using GPS. Each ground truth point has an accuracy of +/-3cm R.M.S.E. […] All LIDAR surveys must report an error of less than +/-15cm RMSE and 10cm for standard deviation and random error to pass quality control.
Environment Agency, LiDAR Ground Truth Surveys Technical Note
So plus or minus 15 cm is what a survey must achieve on a tennis court to be accepted at all. It is a floor. Established on the most favourable surface available, it says nothing about what the data delivers in a hedgerow, on an embankment or on a river bank.
Peer-reviewed work on discrete-return airborne LiDAR found that quoted elevation errors corresponded to the expected value "in urban areas only", with global errors reaching up to five times the quoted figure, errors within individual vegetation classes reaching up to fifteen times, and a strong skew pushing some cases beyond twenty-five times. That study covered a site in Ireland, not England, and the exact multipliers are site-specific. The mechanism is general: filtered ground returns under vegetation are sparse, and interpolating between them introduces error that no published accuracy statement captures.
| Source | Stated vertical accuracy | Basis of the figure |
|---|---|---|
| GNSS ground truth points | ±3 cm RMSE | Environment Agency ground truth survey specification |
| Environment Agency LiDAR | ±15 cm RMSE | Quality control threshold, measured on flat hard standing |
| OS Terrain 5 | 1.5 m RMSE urban, 2.5 m rural and moorland | Ordnance Survey product specification |
| OS Terrain 50 | 4 m RMSE | Ordnance Survey product specification |
The comparison that matters is the first two rows. On the Environment Agency's own published numbers the GNSS survey used to validate LiDAR is roughly five times more accurate vertically than the LiDAR it validates, and that is against LiDAR's best case. When a finished floor level is set against a design flood level, with freeboard commonly at 300 mm, a 150 mm best-case terrain error consumes half of it before any other uncertainty is counted, and before any climate change allowance is applied to the flood level itself. The same arithmetic governs the banded surface water depths now published on the Flood Map for Planning, which only become a level once compared against land levels.
Plus or minus 15 cm is what a LiDAR survey must achieve on a tarmac car park to pass quality control. It is a floor, not a site accuracy.
Not sure whether free LiDAR will carry your site's levels?
Unda establishes what terrain data exists over a site, how old it is and whether it is sufficient evidence, before any assessment is drafted.
Get a quote in 60 minutesWhat LiDAR cannot see
Airborne LiDAR measures the first surface a laser pulse strikes. Water, covered structures and anything built after the flight are therefore absent, misrepresented or invented. Water is the most serious case, because the Environment Agency fills those gaps to keep the model continuous and the published raster gives no indication whatever of which cells are measurement and which are fill.
The Environment Agency describes its own DTM production in terms that deserve close reading: "Areas of no data, such as water bodies, are also filled to ensure there are no gaps in the model." Near-infrared LiDAR does not penetrate water. Over a river, lake or pond it returns the water surface or nothing at all, and the values that appear there in the published DTM are interpolated fill rather than measured ground.
Any channel cross-section extracted from the Environment Agency DTM is a section through interpolated fill, not a survey of the bed.
- Watercourse beds. Not measured, and silently filled. Channel geometry for hydraulic modelling comes from ground or bathymetric survey. The agency's blended SurfZone DEM combines LiDAR with multibeam sonar, but it covers the intertidal zone only.
- Culverts, bridges and headwalls. A covered structure is invisible to an overhead sensor. Screens, soffit levels and inlet geometry all require inspection or survey, which matters wherever an ordinary watercourse crosses a site.
- Small barriers to flow. Kerbs, low walls, thresholds and field boundaries fall below the resolution of a 1 m grid, yet these are precisely the features that route shallow surface water and exceedance flows across a site.
- Vegetation on steep or dense ground. Filtering removes what it identifies as vegetation, and where ground returns are sparse the surface between them is interpolated. Dense evergreen cover and undercut banks are the worst cases. Nor does any elevation model say anything about what lies beneath the surface, which is why infiltration testing and groundwater levels remain separate investigations.
- Recent change. Anything built, stripped, filled or regraded after the capture date is absent. On a development site this is frequently the whole point of interest.
None of this is a reason to avoid LiDAR. It is the reason a competent assessment states where the terrain evidence came from and where it was supplemented, which is also what makes a national map worth testing against site levels instead of accepting at face value, and occasionally what supports a request to review a mapped extent.
Which LiDAR resolution do you need?
One metre is sufficient for catchment delineation, overland flow routing and site-scale screening, and it is the highest resolution the current composite offers. Two metre data serves broad catchment work and is the default across much of Wales. Anything requiring kerb, threshold or channel detail needs ground survey, not a finer grid.
Resolution describes the spacing of the published grid, not the density of the underlying measurements. A finer grid adds no information that was never captured. A 1 m DTM resampled from a sparse point cloud beneath woodland looks smooth and confident, and is no more accurate than the returns it was built from.
Across the UK, 1 m is the working standard for England and Wales. Two metre is the fallback where continuity matters more than detail. The 25 cm and 50 cm data surviving in the Time Stamped archive should be looked for, never assumed available. For strategic assessments covering whole catchments, and for interpreting national modelled outputs such as NaFRA2, the coarser products are often the sensible choice.
Vertical datum, and why your site GPS levels may not match
Environment Agency LiDAR is published in metres above Ordnance Datum Newlyn using the OSTN15 transformation. Older tiles within the composite were transformed under earlier models, and a GNSS receiver reporting ellipsoidal height will not agree with the raster unless the same geoid model is applied. Level discrepancies of this kind are a transformation problem, not a data error.
The Environment Agency ships an OSGM02 to OSGM15 adjustment grid alongside the archive for exactly this reason, and the Time Stamped index records the transform and geoid applied to each tile. Where a composite tile draws on surveys from different eras, those attributes are not necessarily consistent across a single site.
The discipline is straightforward: establish which datum and transformation the LiDAR used before comparing it to anything, reconcile site benchmarks and levels drawings to the same datum, and treat an unexplained systematic offset between surveyed and LiDAR levels as a datum question first and a data question second.
LiDAR coverage in Wales, Scotland and Northern Ireland
Coverage outside England is uneven. Wales has effectively complete 1 m national coverage from the Welsh Government programme flown between 2020 and 2023. Scotland has no national coverage at all, only discrete phases, several of which originated as a utility's asset survey and follow the power network rather than the floodplain.
- Wales. The Welsh Government LiDAR programme published 1 m DTM and DSM tiles captured between 2020 and 2023, covering the country in 1 km tiles with per-tile capture dates available. Natural Resources Wales holds a separate legacy archive covering approximately 70% of Wales at 25 cm to 2 m. Both are published under the Open Government Licence through DataMapWales.
- Scotland. The Scottish Remote Sensing Portal publishes Scottish public sector LiDAR in phases, not as national coverage. Phase 1 was commissioned in response to the Flood Risk Management Act 2009 and covers 11,845 square kilometres across ten sites. Phases 4 to 6 were captured for Scottish Power Energy Networks and bought for public use, so their footprints follow overhead lines. Licensing varies by phase and should be checked, not assumed.
- Northern Ireland. Holdings are published through OpenDataNI, separately from all of the above, and coverage is partial.
For a site in Scotland outside a covered phase, or in a Welsh gap, the options are commercial data or a commissioned survey. There is no free national fallback equivalent to the English composite.
When a measured topographical survey is needed instead
Free LiDAR is desk-study evidence. A measured survey is site evidence. One must replace the other wherever a decision turns on a level LiDAR cannot supply to the necessary confidence: finished floor levels, threshold levels, channel geometry, compensatory storage volumes and anything a consultee will test against a design flood level.
Unda's explainer on when a topographical survey is needed for an FRA or SuDS scheme sets out the comparison in detail. A topographical survey is the only evidence that settles a level dispute, and the circumstances that force one are consistent.
- The site has changed since capture. Established from the survey index, not assumed.
- Levels are being set, not screened. Threshold and finished floor levels against a design flood level need better than a 150 mm best-case error.
- The argument depends on channel or structure geometry. LiDAR supplies neither, and safe access across a dry island site is decided by exactly these levels.
- The site is vegetated, steeply sloping or densely built. These are the conditions in which published accuracy statements least reflect reality.
- Volumes are being calculated. Compensatory storage designed level for level requires levels LiDAR cannot certify.
Nothing in national policy settles this. The August 2026 National Planning Policy Framework contains no reference to topographic survey, ground levels or LiDAR.
The Environment Agency's river modelling technical standards ask only for "any topographic survey data you have collected for the project". The judgement is left to the assessor, which is precisely why stating the terrain evidence and its date carries weight with a consultee, and why a bespoke flood model built on surveyed levels is often what settles a case that national mapping alone cannot.
Can LiDAR data be used in a fee-earning report?
Yes. Environment Agency LiDAR is published under the Open Government Licence v3.0, which permits commercial re-use, including in chargeable reports, provided the attribution statement is included. Welsh and Scottish holdings are also published under the Open Government Licence, though Scottish licensing varies by phase and should be confirmed for the phase in use.
The attribution the Environment Agency specifies is short enough to sit in a figure caption: "© Environment Agency copyright and/or database right 2022. All rights reserved." Ordnance Survey products sit under different terms: OS Terrain 50 is open data, while OS Terrain 5 is chargeable and is not included in the Public Sector Geospatial Agreement.
Using LiDAR data well
Free elevation data has made a great deal of desk-based flood risk and drainage work faster and better than it was a decade ago. It has not made site survey optional, and the gap between the two is widest exactly where the consequences are greatest. Three questions settle whether a downloaded tile can carry a decision: when it was flown, what the filtering removed, and which cells were never measured at all. Unda answers those questions as a matter of course when preparing a flood risk assessment or a surface water drainage strategy, and a property purchase case study shows what interrogating the elevation data changed for one buyer. Advice on what terrain evidence a particular site and consultee will require is available on request.
LiDAR data: frequently asked questions
Can LiDAR data be viewed in Google Earth?
No. Google Earth renders its own global terrain, which is far coarser than UK LiDAR and is not the published Environment Agency surface. A downloaded GeoTIFF needs GIS software to display and interrogate properly, and converting a tile to KML for Google Earth discards the elevation values that make it useful in the first place.
What are the three types of LiDAR?
Airborne, terrestrial and mobile. The national datasets described here are all airborne, flown from fixed-wing aircraft. Terrestrial LiDAR is tripod-mounted and used for detailed structure or site scanning. Mobile LiDAR is vehicle-mounted and used mainly for highways and corridor survey. Bathymetric LiDAR, which uses a green wavelength to penetrate water, is a separate specialism and does not form part of the Environment Agency's published national holdings.
How much LiDAR data can be downloaded at once?
Public users of the Defra Survey Data Download service take one 5 km tile at a time, and there is a limit on the size of the area of interest that can be selected. Larger areas require a Large Data Request submitted to the Environment Agency, which needs building into the programme on any catchment-scale piece of work.
Is the whole of England actually covered?
Almost. Coverage is approximately 99% at 1 m, with a small number of excluded areas, the best known being around RAF Fylingdales in North Yorkshire. Coverage gaps are not the practical problem in England. The age of the data within the covered area is.
Does commercial LiDAR give better accuracy than the free data?
It can. Commercial providers publish higher point densities and better stated vertical accuracies than the Environment Agency's 15 cm threshold, and a commissioned survey is flown on a chosen date, which removes the mixed-vintage problem entirely. Those are supplier specifications, and they should be evidenced for the particular capture, not accepted generally.
Does LiDAR show where water will flow across a site?
It shows the shape the water responds to, which is not the same thing. A DTM supports overland flow routing and catchment delineation, but a 1 m grid smooths out the kerbs, thresholds and low walls that divert shallow flows in practice, and it carries nothing at all of the below-ground drainage network.
About the author. Freya is a Flood Risk Consultant focused on planning (NPPF/TAN15), insurance and property. Unda has been trading since 2014, is a CIWEM Business Partner with CIWEM member and chartered (C.WEM MCIWEM) consultants, and has delivered 5,000+ flood risk assessments and drainage strategies across England and Wales.
Freya Pott · MSc, BSc (Hons), GradCIWEM
Latest news



One of our experienced Flood Risk Consultants will get back to you within 60 minutes
