Sea Level Rise and Planning: Why 2100 Is No Longer the End of the Story
Estimated reading time 13 minutes
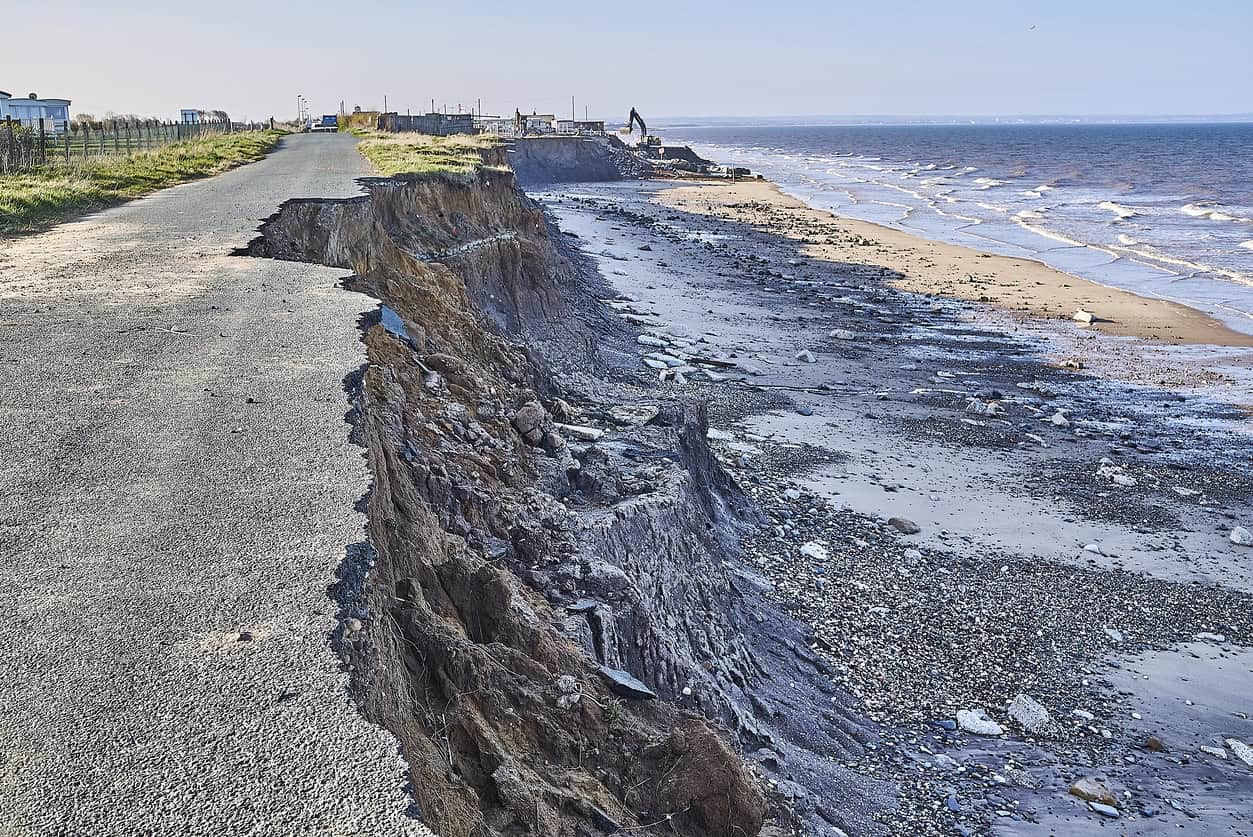
For most of UK practice, sea level rise and planning meet at a single tidy horizon: the end of this century. Flood risk assessments run their allowances out to the 2120s, defence schemes are appraised on similar timescales, and almost nothing looks beyond. A study published in Nature Communications on 21 July 2026 suggests that habit needs to change. The research, led by scientists at the Met Office Hadley Centre and the University of Bristol with flood modellers at Fathom, is the first to model coastal flood exposure for the whole of the UK out to 2300. Its central finding is uncomfortable: exposure grows modestly to 2100 whatever we do. What happens after that depends almost entirely on emissions and the behaviour of the ice sheets.
Under the study's most pessimistic storyline, an additional 13 million people could be exposed to the 1-in-200-year coastal flood by 2300 – more than 20% of the population of England, Scotland and Wales.
What does the new study actually say?
The study models coastal flooding across the whole UK at 20–25 m resolution under five physically consistent sea-level rise "storylines", spanning strong emissions cuts through to runaway Antarctic ice loss. By 2100, every storyline adds at least 0.5 million people to the population exposed to the 1-in-200-year flood extent, a 25% increase on the present day. After 2100, the storylines part company dramatically.
- Committed near-term rise. All five storylines produce broadly similar results to 2100, because decades of sea level rise are already locked in by past emissions and the slow response of the oceans and ice sheets.
- Current pledges. If international emissions pledges are met (Storyline B), around 1.7 million more people are exposed by 2300, with local sea level rise of roughly 1.2–1.8 m and a 56% increase in the 1-in-200-year flood area.
- Paris targets. Meeting Paris Agreement goals (Storyline A) would avoid up to 1 million of that additional exposure – exposure grows by only 28%.
- Worst case. Under Storyline H2, where Antarctic ice-sheet instability dominates, UK sea level rise reaches 16.5–17.5 m by 2300 and the flood area grows by more than 300%.
- Undefended by design. The model deliberately excludes flood defences, because no dataset projects defence standards to 2300 – so the maps show potential exposure, not a prediction of who floods.
The full paper, "Quantifying UK coastal flood exposure under future sea-level rise to 2300" (Palmer, Savage, Bates and Neal, Nature Communications, 2026), is open access. Matt Palmer, the study's lead author, describes sea level rise as "the 'sleeping giant' of climate change" in the University of Bristol's announcement – the oceans and ice-covered regions respond so slowly to warming that choices made this century play out for hundreds of years.
The five storylines, from best case to runaway ice loss
Rather than a single central projection with error bars, the study uses five narrative storylines, each a physically consistent trajectory of how sea level could evolve. This is the same approach the IPCC's Sixth Assessment Report (AR6) took to communicate low-likelihood, high-impact outcomes, and the storylines are built on the same projection machinery as the UKCP18 climate projections that underpin current UK planning guidance.
| Storyline | Scenario | Narrative | Approx. UK sea level rise by 2300 |
|---|---|---|---|
| A | RCP2.6 / SSP1-2.6 | Strong emissions cuts this century; a plausible best case | ~0.1 m (Belfast, Edinburgh) to ~0.7 m (Cardiff, London) |
| B | RCP4.5 / SSP2-4.5 | Moderate warming, roughly in line with current international pledges | ~1.2–1.8 m |
| C | RCP8.5 / SSP5-8.5 | High emissions with high climate sensitivity | ~3.5–4.5 m |
| H1 | RCP8.5 + ice-sheet instability | Substantial instability processes active on both Greenland and Antarctica | ~8.5–9.5 m |
| H2 | RCP8.5 + runaway Antarctic instability | Runaway ice loss dominated by Antarctica; the "reasonable worst case" | ~16.5–17.5 m |
Storyline B is the study's baseline, consistent with current international emissions pledges. Storyline H2 is a reasonable worst-case scenario in the sense used by the UK National Risk Register: a challenging manifestation of the risk after highly implausible scenarios are excluded. The IPCC states this outcome cannot be ruled out under high emissions. Even at 2100 the difference matters: UK sea level rise reaches roughly 0.6 m under Storyline B but 1.2–1.5 m under H2.
Which parts of the UK are most exposed?
Low-lying eastern England stands out first. At 2100, the largest increases in flood extent are around the Wash and the Humber Estuary, where the national 1-in-200-year flood area grows by 13% under Storyline B and 41% under H2. By 2300 the geography widens to include the Thames estuary, eastern Norfolk, North Somerset, Gloucestershire, Liverpool and the north-west coast of England.
The low-lying areas will be hit hardest by sea-level rise. The Wash and Humber Estuary stand out as hotspots.
Dr James Savage, Head of Flood Modelling at Fathom and study co-author
The mapping gets uncomfortably specific. Under Storyline B, which assumes current pledges are met and the ice sheets behave, the Senedd in Cardiff, Glasgow Airport, Teesside's chemical works and the port of Dover all sit within the 200-year flood zone by 2300. Under Storyline H2, the M25 around Heathrow, the City of London's financial district and St Paul's Cathedral join them, large areas of west and north London see water depths above 1 m, the Lincolnshire Wolds become an island during extreme floods, and coastal flooding propagates inland as far as Cambridge and York, both of which see their central areas flooded to depths of a metre or more.
Under current emissions pledges alone, the Welsh Parliament building, Glasgow Airport and the port of Dover fall within the 1-in-200-year flood zone by 2300.
These are undefended extents – London, for example, is currently protected by the Thames Barrier and its associated defences – but that is precisely the study's point. For sea level rise measured in metres, present-day defences are largely irrelevant; the question becomes what level of defence, and for how long, each place can sustain.
Why current planning guidance stops at 2100 – and why that now matters
The awkward part is the guidance itself. The Environment Agency's climate change allowances for flood risk assessments give sea level rise values of roughly 1.0–1.6 m over the period 2000 to 2125, depending on location. Where a "credible maximum scenario" is appropriate – ports, nuclear sites, other long-lived critical infrastructure – planners are advised to use the H++ value of 1.9 m by 2100. Beyond that time horizon, no national guidance exists at all.
To 2100, the study is reassuring about that framework. Peak sea level rise across all five storylines at 2100 is about 1.5 m, which the combination of the published allowances and the residual uncertainty allowances used in defence design should broadly accommodate. Population exposure under Storyline B rises by 25% by 2100, slightly below the 27% increase in properties at risk by 2069 already projected by the new National Flood Risk Assessment – so the study sits consistently with, if slightly conservative against, current government projections for this century.
Beyond 2100 the framework simply runs out. Under Storyline H2, sea level rise exceeds the 1.9 m H++ credible maximum within a few decades of 2100, on its way to a five-fold increase in population exposure by 2300. Nothing in the National Flood Risk Assessment's range comes close. The UKCP18 projections did include exploratory sea level numbers to 2300, but the H+ and H++ credible-maximum scenarios were never extended past 2100. For anything designed to outlast the century – and much of our housing stock, transport infrastructure and coastal defence will – the guidance horizon and the risk horizon no longer match.
The "credible maximum" UK planners are told to test against – 1.9 m of sea level rise by 2100 – could be exceeded within a few decades of 2100 under the ice-sheet instability storyline.
Our guide to the climate change allowances explains how the current framework applies to flood risk assessments today.
What happens to flood defences after 2100?
The study also checked its modelled water levels against the recorded crest heights of England's coastal defences. To 2100 the picture is manageable; beyond it, the numbers turn stark.
- Storyline B, 2100. Less than 1% of England's modelled defences see water levels exceed their crest height by 1 m or more.
- Storyline B, 2200–2300. That figure rises to 27% by 2200 and 35% by 2300, and roughly half of England's coastal defences would need investment over the following two centuries just to maintain current standards.
- Storyline H2. 10% of defences are overtopped by a metre or more by 2100, rising to nearly 100% by 2200 – with more than 99% of defences beyond hard adaptation limits.
- London's engineering limit. Earlier research on the Thames Estuary puts the practical limit of engineered adaptation for London at around 5 m of sea level rise – a threshold reached at roughly 2150 under Storyline H1 and 2200 under H2.
The Thames Estuary 2100 project offers the template the study's authors point to: an adaptation pathways approach, where decisions are staged and triggered by observed sea level milestones rather than fixed dates. The Environment Agency's Fens 2100+ programme is asking similar questions of England's largest lowland system. But the study is blunt that for multiple metres of rise, holding every current coastline would be prohibitively difficult, and a combination of enhanced defences and managed retreat – the movement of settlements and infrastructure away from the coast – becomes inevitable. The UK has no national framework for that yet, as the piecemeal buyout of flood-prone homes at Clydach Terrace showed.
Care is needed in presenting this work, as it includes high end storylines... the worst impacts of sea-level rise can still be avoided through decisions made now and in the coming years.
Dr Joanne Williams, National Oceanography Centre, commenting via the Science Media Centre
That balance matters. Independent experts reviewing the study described its methodology as robust while stressing that the high-end storylines are avoidable outcomes, not forecasts.
What should developers and planners do now?
Nothing in the study changes what a flood risk assessment must contain in 2026. What it changes is the mindset for long-lived decisions, and it strengthens the case for doing the near-term work properly.
- Apply the current allowances rigorously. Sea level rise allowances compound over a development's lifetime; a residential scheme assessed today is typically tested against conditions towards 2125. On tidal and estuarine sites, the sea level allowance usually matters more than peak rainfall.
- Use the credible maximum where it applies. For essential infrastructure and developments with lifetimes beyond the ordinary, the H++ scenario (1.9 m by 2100) is the appropriate stress test under current guidance – and this study reinforces why.
- Design for adaptability, not just compliance. Where a site allows it, choices that keep future options open (higher floor levels, adaptable ground floors, space for defences to be raised) cost little now and become very valuable if the higher storylines materialise.
- Check coastal exposure early. On coastal and estuarine sites, establish the flood picture before design is fixed. A site-specific flood risk assessment tests actual ground levels and defence standards against the allowances, which national screening maps cannot do.
- Watch the ice sheets. The study calls for continuous monitoring of sea level rise, with particular emphasis on the ice sheets, so that observed trends can be compared with expectations. Adaptation planning should be built to respond to that evidence as it arrives.
Sea level rise is already changing the frequency of coastal flooding in the UK, as we covered when two attribution studies were published earlier this year. The new study extends that story forward: the near-term risk is assessable and manageable with the tools we have; the long-term risk depends on choices that are still open. If you are planning development on a coastal or tidal site, our consultants prepare site-specific flood risk assessments that apply the current climate change allowances, including the credible maximum scenarios where they are warranted.
Frequently asked questions
How likely is the worst-case 13 million scenario?
No probability can be attached to it – that is why the study uses storylines rather than forecasts. Storyline H2 depends on runaway Antarctic ice-sheet instability, a process the IPCC says cannot be ruled out under high emissions but whose likelihood is genuinely unknown. The study's authors assess it as consistent with the National Risk Register's definition of a reasonable worst case: challenging but not implausible. Scientists at the British Antarctic Survey note that recent observations of ice-shelf decline suggest high-end outcomes deserve to be treated as genuine possibilities rather than remote ones.
If emissions fall, will UK flood risk stop rising?
Not this century – roughly the same exposure growth to 2100 occurs under every storyline, because of sea level rise already committed by past emissions. The dividend arrives later and it is large: meeting Paris Agreement targets rather than current pledges avoids up to 1 million people's worth of additional exposure by 2300, and the gap between the best and worst storylines by then is measured in tens of millions.
Does this study mean the current flood maps are wrong?
No. The Flood Map for Planning and the National Flood Risk Assessment describe present-day and this-century risk, include defences where they exist, and remain the correct basis for planning decisions now. The new study deliberately models an undefended coastline on a much longer horizon to show where exposure could emerge. Where the two overlap – this century – the study's results sit slightly below existing government projections.
Why does the same storyline produce such different sea level rise around the UK?
Because the land itself is moving. Since the last ice age, Scotland and Northern Ireland have been slowly rising while southern England sinks – a process called glacial isostatic adjustment. Under the low-emissions storyline this halves the effective rise in Belfast and Edinburgh (0.1–0.2 m by 2300) compared with Cardiff and London (0.6–0.7 m). Under the ice-sheet storylines, the gravitational "fingerprint" of where the ice is lost also shapes the UK pattern, which is why the study's maps differ markedly from a uniform global average.
Latest news


One of our experienced Flood Risk Consultants will get back to you within 60 minutes
