Sea level rise in the UK: how much, how fast, and what it means for coastal flood risk
Estimated reading time 18 minutes
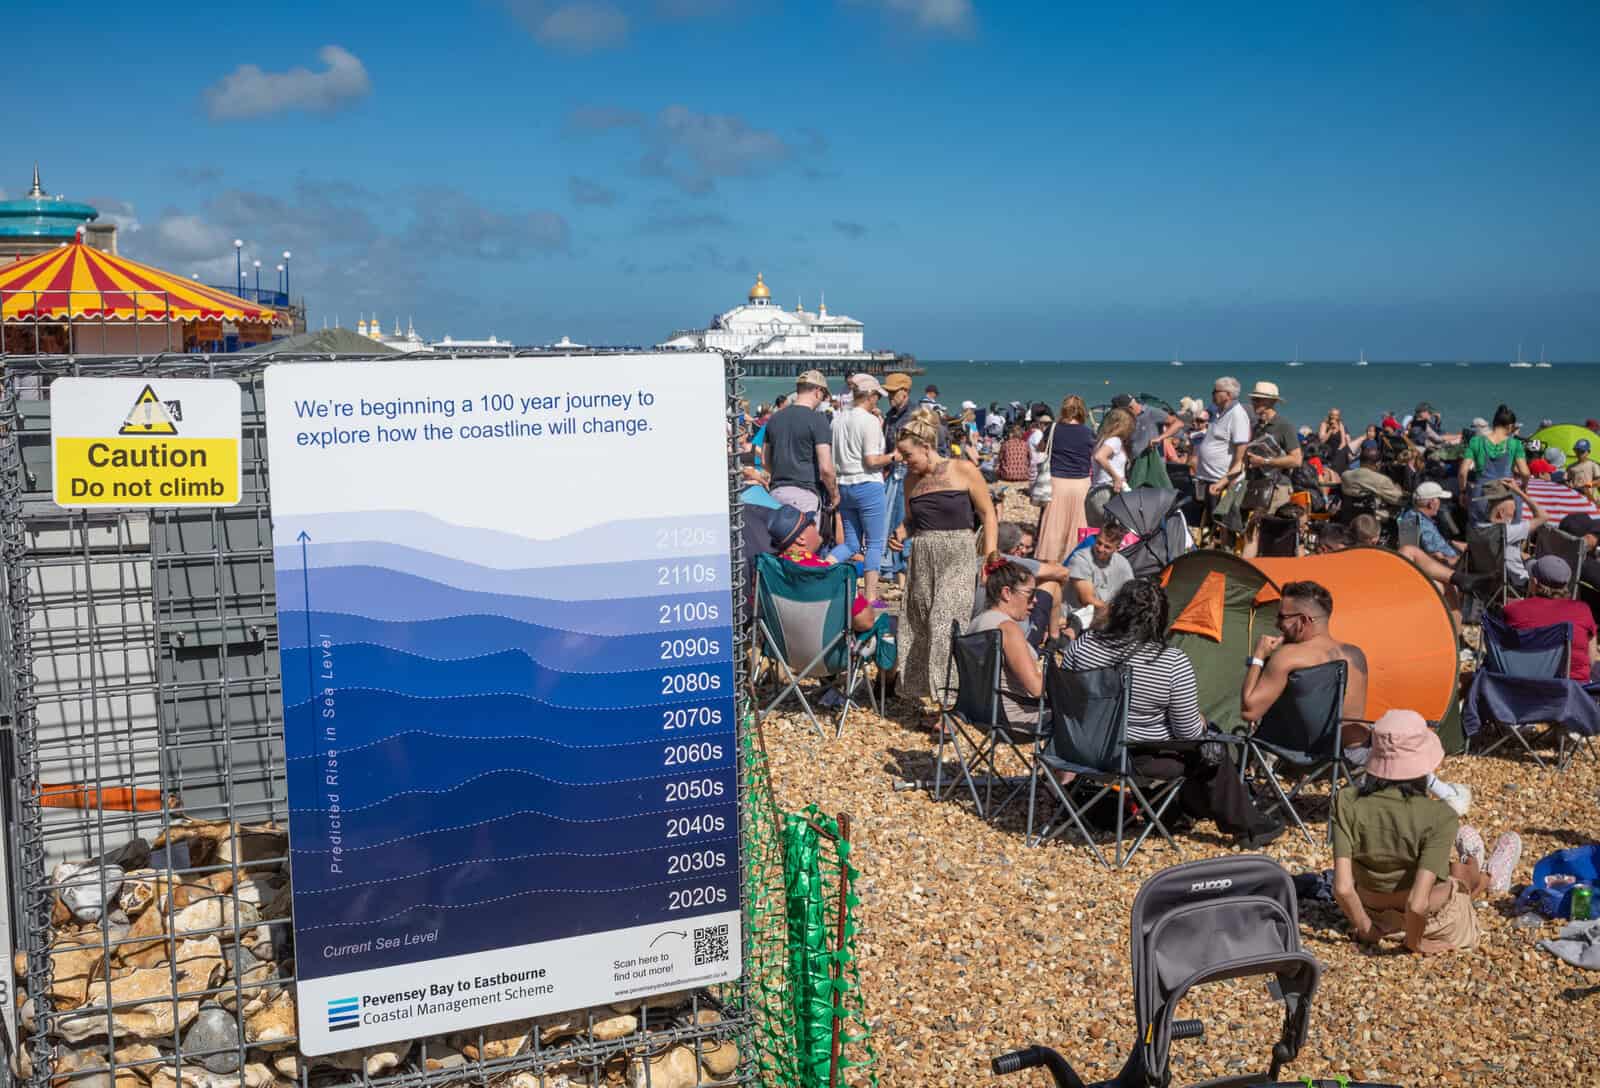
Sea level rise around the UK has stopped being a projection to argue over. It is a measured record. Mean sea level around these islands has risen by about 20.1 cm since 1901, and roughly two-thirds of that rise has happened in the last three decades. That is where this article starts, because it is the figure most coverage of UK sea level rise leaves out, and it is the one that changes how a coastal or tidal site should be assessed.
About two-thirds of the 20.1 cm of sea level rise recorded around the UK since 1901 has happened since the mid-1990s.
Two studies published in June 2026 established that the coastal flooding already being recorded is driven in large part by human-caused sea level rise. Those findings still stand, and they are set out below. But the more useful question for anyone with a site on an estuary or a stretch of open coast is the practical one: how much has the water risen where I am, how fast is it moving, and what will a planning authority expect me to do about it.
How much has sea level risen around the UK?
Around 20.1 cm since 1901, with a likely range of 16.6 to 23.6 cm. The figure comes from the Met Office's State of the UK Climate in 2025, published in the International Journal of Climatology in July 2026, and it is drawn from the UK tide gauge network rather than from a model.
- Total rise since 1901: about 20.1 cm, with a likely range of 16.6 to 23.6 cm, measured at UK tide gauges.
- Distribution: roughly two-thirds of that rise has occurred in the last three decades.
- Direction of travel: the Met Office describes the observed record as accelerating.
- What it is not: this is rise already banked, before any allowance for what happens next.
The distribution matters more than the total. A 20 cm rise spread evenly across 124 years would be a slow background trend that defences built in the 1970s could reasonably be expected to absorb. Two-thirds of it arriving since the mid-1990s is a different proposition, because it means most of the change has happened inside the design life of infrastructure that is still in service.
How fast is UK sea level rising, and is it accelerating?
The long-term rate for Great Britain is 2.12 mm per year, plus or minus 0.02 mm, once the record is adjusted for land movement. What gives that number its force is the comparison with the nineteenth century, when the same analysis found a rate of 0.24 mm per year. It also reports a measured acceleration of 0.012 mm per year squared across the period 1813 to 2018, so the rate itself is climbing.
A second figure appears in UK practice and is worth separating out. The National Tidal and Sea Level Facility publishes a UK average of 1.4 mm per year for the long-term climate change component of mean sea level change. That is a narrower quantity than the 2.12 mm per year trend, computed on a different dataset a decade earlier. The two are not competing estimates of the same thing, and setting one against the other is a common error.
For anyone working on an estuary, the most useful evidence is what a single long-record gauge shows. The Environment Agency's ten-year monitoring review for Thames Estuary 2100 published both the century-scale and the recent trend at Southend-on-Sea.
| Period | Average rate | Total rise |
|---|---|---|
| 1911 to 2018 | 1.4 mm per year | About 15 cm |
| 1990 to 2018 | 3.6 mm per year | — |
The Environment Agency notes that 1.4 mm per year sits inside the IPCC's likely range for 1902 to 2015, and that 3.6 mm per year sits inside the very likely range of 3.1 to 4.1 mm per year for 2006 to 2015. The acceleration at Southend is not a quirk of the local record. It is the global signal turning up at a British gauge.
That is the point where sea level stops being a climate story and becomes a design input. Where a site sits behind a tidal defence, the standard of protection that defence was built to was calculated against a baseline that has since moved. A coastal flood risk assessment for planning has to work from the water level the scheme will face across its lifetime, not the one recorded when the defence was designed.
Why does the UK sit apart from the global average?
The Met Office and the National Oceanography Centre both report that UK sea level is now rising faster than the global average, a finding first highlighted in the State of the UK Climate report published in July 2025. Neither publishes a numerical margin for the gap, so no figure should be attached to it.
For scale, satellite altimetry puts the global rate at roughly 2.0 mm per year in 1993, rising to about 4.4 mm per year today. That is a doubling inside three decades, and it is the backdrop against which the UK figures should be read.
There is a second reason the UK reads differently, and it has nothing to do with the ocean.
Why Scotland and southern England are moving in opposite directions
Britain is still adjusting to the loss of the ice sheet that covered it during the last glaciation. Northern Britain, which carried the weight, is rebounding upwards. Southern Britain, which bulged up in compensation, is settling back down. This is glacial isostatic adjustment, and it is why the same rise in ocean volume produces different results at Aberdeen and at Southend.
The observed and predicted values for vertical motion are highly correlated indicating that GIA is the dominant geodynamic process contributing to this field.
Bradley and others · Glacial isostatic adjustment of the British Isles, Geophysical Journal International, 2009
GPS measurement across the British Isles found maximum uplift of 1.07 mm per year, plus or minus 0.35 mm, at an eastern Scotland site, and maximum subsidence of 1.2 mm per year, plus or minus 0.40 mm, at Lowestoft. Modelled figures put most of southern and eastern England between 0.6 and 0.8 mm per year of subsidence.
The Thames estuary is the best-resolved case. Satellite radar surveying by the British Geological Survey found most of the area around the estuary subsiding at between 0.9 and 1.5 mm per year, reaching 2.1 mm per year over thick Holocene deposits, while parts of west and north London sat below 0.7 mm per year and a few areas rose slightly.
The consequence is the distinction that governs coastal flood risk work. Relative sea level is what a tide gauge measures and what floods a coastline: ocean change plus land movement. Absolute sea level is ocean change alone. Along the Thames the BGS recorded a relative rise of 1.8 to 3.2 mm per year against an absolute rise of about 1 mm per year.
On the Thames the sea has risen at 1.8 to 3.2 mm a year relative to the land, against an absolute rise of about 1 mm a year. The rest is the ground going down.
This is worth grasping before reading any national map, because the Environment Agency's design allowances are expressed in relative terms and already account for slow land movement. Adding a separate subsidence correction on top of them counts it twice.
Why a small rise multiplies the number of floods
A coastline is not flooded by mean sea level. It is flooded by an extreme still water level, which is the mean level plus the astronomical tide plus the storm surge, with wave action handled separately on top. The Environment Agency's coastal flood boundary dataset, which underpins UK coastal flood mapping, models the joint probability of skew surge and predicted high tide at roughly 2 km spacing along the open coast, for return periods from 1 in 1 to 1 in 10,000, to a base year of 2017.
Mean sea level is the floor the other components stand on. Raise it and every tide and every surge starts from higher up, so a storm that would once have stayed inside the defences now tops them. The storms do not have to get worse for the flooding to get worse.
What that does to frequency is not subtle. A Government Office for Science evidence review found that on the Lincolnshire coast a 0.5 m rise in sea level cuts the standard of protection tenfold, from a 1 in 100 year event to a 1 in 10. The same review projected that by the 2080s a 1 in 100 year standard would fall to 1 in 5 in mid-west Wales and 1 in 8 in south-east England under a low to medium scenario.
A 0.5 m rise turns a 1 in 100 year coastal flood into a 1 in 10 year event on the Lincolnshire coast.
The Environment Agency has put the same mechanism in national terms: extreme sea levels with a 1 per cent annual chance of occurring on the English Channel coastline in 1990 are projected to reach a 10 per cent annual chance by 2100. This is the arithmetic that makes centimetres consequential, and it is why a scheme that clears today's design level by a comfortable margin can still fail its lifetime test. It is also why a site can remain in a flood zone after new defences are built. The residual risk behind a defence grows as the baseline rises beneath it.
What the attribution research found
Two papers published in June 2026 established that this is already happening rather than merely forecast. The research made headlines worldwide, including coverage in The Independent.
The first, led by scientists at Climate Central and published in Science Advances, analysed 519 tide gauges worldwide. It found a human-caused sea level rise signal detectable at 97% of those sites, attributed 58% of the days with extreme water levels between 2000 and 2018 to climate change, and reported that the number of days exceeding extreme thresholds has nearly tripled since the 1970s.
The second, from a Tulane University-led team in Nature Climate Change, came at it through the return period that engineers and planners already use. It found that a coastal flood expected once a century in 1900 is now, on average, about twelve times more likely, with human-caused warming having quadrupled the frequency of these extremes since 1900. At nearly half the sites studied, the old once-a-century event now turns up at least once a decade.
The two used different methods and different metrics, which is much of why they are persuasive together. As Robert Kopp of Rutgers University, a co-author on the Climate Central paper, put it, sea level rise is making both tidal and storm-driven flooding "more frequent, extensive and expensive." Sönke Dangendorf, the Tulane study's lead author, made the mechanical point: smaller storms can now produce flooding that previously required far more severe conditions.
Some perspective is owed. Both studies attribute the rising-baseline component of flooding to human activity rather than the storms themselves. The Tulane analysis stops at 2005 because of the climate models available, which makes its findings conservative if anything. And local conditions vary enormously, as the land movement above shows.
Which parts of the UK are most exposed?
The high-exposure systems are the tidal ones, where surge on a rising baseline rather than rainfall drives the worst events: the Thames Estuary, the east coast and the wider North Sea corridor that flooded catastrophically in 1953, when the surge at Jaywick killed 37 people in a single night, the Humber, and the Severn Estuary. These are the settings where tidal flooding rather than river flow sets the design event.
The Thames Barrier is the clearest long record of what that exposure looks like in operation. It had closed 221 times for flood defence purposes between becoming operational in 1982 and 17 November 2025, of which 119 were against tidal flooding and 102 against combined tidal and fluvial flooding.
- The record does not yet show a sea level signal: the Environment Agency's ten-year monitoring review found no statistically significant increase in annual closure numbers, because the count is dominated by fluvial and storm variability.
- The operating ceiling is 50 closures a year: above that there is not enough time for maintenance.
- The planning has moved even though the record has not: closure-projection modelling brought the first defence-raising deadline for London forward from 2065 to 2050, a fifteen-year acceleration.
- The latest review is blunt about it: the Thames Estuary 2100 fifteen-year monitoring review, published in August 2026, concluded that accelerating sea level rise requires increased long-term investment, improved tidal forecasting and a reassessment of future infrastructure needs, a conclusion that sits alongside the National Audit Office findings on England's flood defences.
For exposure across England, the national assessment published in December 2024 counts 2,435,000 properties at some risk from rivers and the sea combined, of which 367,900 sit in the high risk band, an 87.6% increase on the previous assessment. By the mid-century period of 2036 to 2069 the total rises to 3,096,700, an increase of 27.2%. Those figures combine river and coastal sources, so they are not a coastal-only count. That is worth remembering when reading NaFRA2 data at a site level, or checking a postcode against our flood risk map.
Longer-range work published in Nature Communications in July 2026 modelled UK coastal flood exposure to 2300. Its near-term finding is the one that bears on decisions being made now: by 2100, under every storyline it tested, at least half a million more people are exposed to the 1 in 200 year undefended flood extent, a 25% increase on today. The word undefended is doing real work there, so those are exposure figures rather than expected flooding. We covered the full range of that study's storylines in sea level rise and planning beyond 2100.
What it means for a coastal or tidal flood risk assessment
Sea level rise reaches a planning application through the Environment Agency's climate change allowances, and the sea level allowance behaves differently from the others in ways that catch people out.
- There is no central allowance for sea level. Only the higher central, at the 70th percentile, and the upper end, at the 95th. For flood risk assessments and strategic flood risk assessments the Agency expects both to be assessed.
- Read the right region. The guidance sets allowances for six areas of England. Sites in the Thames river basin district take the south east figures; sites in the Severn river basin district take the south west.
- Read the units carefully. The epoch columns give millimetres per year with the total for that epoch in brackets, and only the final column is cumulative metres. Cumulative rise from 2000 to 2125 runs from 1.01 m in the north west to 1.21 m in the south west on the higher central allowance, and from 1.41 m to 1.62 m on the upper end.
- Do not add a land movement correction. The published allowances already account for slow land movement, so a separate subsidence adjustment counts it twice.
- Apply the credible maximum where it belongs. Nationally significant infrastructure, new settlements and significant urban extensions use the H++ scenario of 1.9 m total rise to 2100.
- Test the whole lifetime. The sequential and exception tests turn on a development being safe for its planned lifetime, which for residential development means a minimum of 100 years. A site that looks marginal against today's levels can look very different against a 2125 allowance, which is where a sequential and exception test report earns its keep.
The regional spread in that table is the glacial isostatic adjustment from earlier in this article arriving in design guidance. The north west and Northumbria figures are lower because the land is rising; the south west and south east figures are higher because it is not.
One caution on currency. The allowances guidance was last updated in May 2022, while the observational record and the 2026 projection work have both moved since. The figures remain the ones to design to, but the direction of travel around them is worth stating in an assessment rather than leaving implied. Where a site also sits within a Coastal Change Management Area, the relevant shoreline management plan policy for the epoch matters as much as the allowance does, and what happens to property owners when that policy changes is still unresolved nationally.
The August 2026 National Planning Policy Framework did not change the allowance figures, but it restructured how flood risk and coastal change are handled in decision-making, with coastal change now sitting under its own decision-making policy. Development that cannot demonstrate it will be safe across its planned lifetime remains exposed to refusal, whichever flood zone it sits in. In practice that safety case rests on finished floor levels set with adequate freeboard above the lifetime design level, and on a workable flood warning and evacuation plan.
Coastal or tidal site to assess?
Our consultants build the sea level allowance in from the start and test the scheme across its whole design lifetime. Quotes back within 60 minutes.
Start a quoteFrequently asked questions
Does sea level rise change my site's flood zone on the Flood Map for Planning?
No. Flood zones are defined ignoring both climate change and the presence of defences, so the allowance never moves a site from Zone 3 to Zone 2 or the other way round. What it changes is the water level the scheme has to be designed against and the case that has to be made for it. That is why a Zone 3a site can still be consented and a Zone 2 site can still fail on lifetime safety. Our explainer on the Flood Map for Planning sets out what the map does and does not show.
My site is in the Thames river basin district. Which sea level allowance do I use?
The south east figures. The Environment Agency publishes allowances for six areas of England, and the Thames river basin district is not one of them. Sites in the Severn river basin district take the south west figures on the same basis. Picking the geographically nearest row instead of the one the guidance names is a common and avoidable error.
Do the same allowances apply in Wales and Scotland?
No, and the two systems are not variations on the English one. Wales assesses flood consequences under TAN15, with its own allowances structured by river basin district. See our guide to the flood consequence assessment. Scotland runs a separate SEPA framework. Carrying English figures across either border is a technical error rather than a matter of judgement.
How do I read an allowance for a specific year such as 2050?
Work from the epoch columns rather than interpolating the cumulative total. Each epoch column gives a rate in millimetres per year with that epoch's total in brackets, so a 2050 figure is the completed 2000 to 2035 epoch plus the annual rate for the 2036 to 2065 epoch multiplied by the years elapsed within it. Both the higher central and the upper end need working through, because there is no single central figure to fall back on.
Can I use the tide gauge nearest my site to work out a local trend?
Rarely, on its own. Decadal variability in UK sea level is large enough that a short record produces an unstable trend, which is why the published national figures rest on records reaching back into the nineteenth century. Site-specific work normally takes extreme water levels from the national coastal flood boundary dataset and applies the allowances to them, rather than fitting a trend to a nearby gauge. Where the levels themselves are contested, hydraulic modelling settles it.
Unda advises developers, landowners and planning teams on flood risk assessments across England and Wales, including coastal and tidal sites and the application of Environment Agency climate change allowances. If you are weighing up a site exposed to rising sea levels, we can tell you what the risk looks like across the scheme's lifetime before it starts shaping the application. Call 01293 214444 or email enquiries@unda.co.uk.
About the author. Edward is a co-founder and Director of Unda with 20+ years in flood risk and drainage, and a national-press commentator on flooding. Unda has been trading since 2014, is a CIWEM Business Partner with CIWEM member and chartered (C.WEM MCIWEM) consultants, and has delivered 5,000+ flood risk assessments and drainage strategies across England and Wales.
Edward Bouët · BSc (Hons)
Latest news



One of our experienced Flood Risk Consultants will get back to you within 60 minutes
