What Is a Storm Surge? How Surges Form and Flood the UK Coast
Estimated reading time 17 minutes
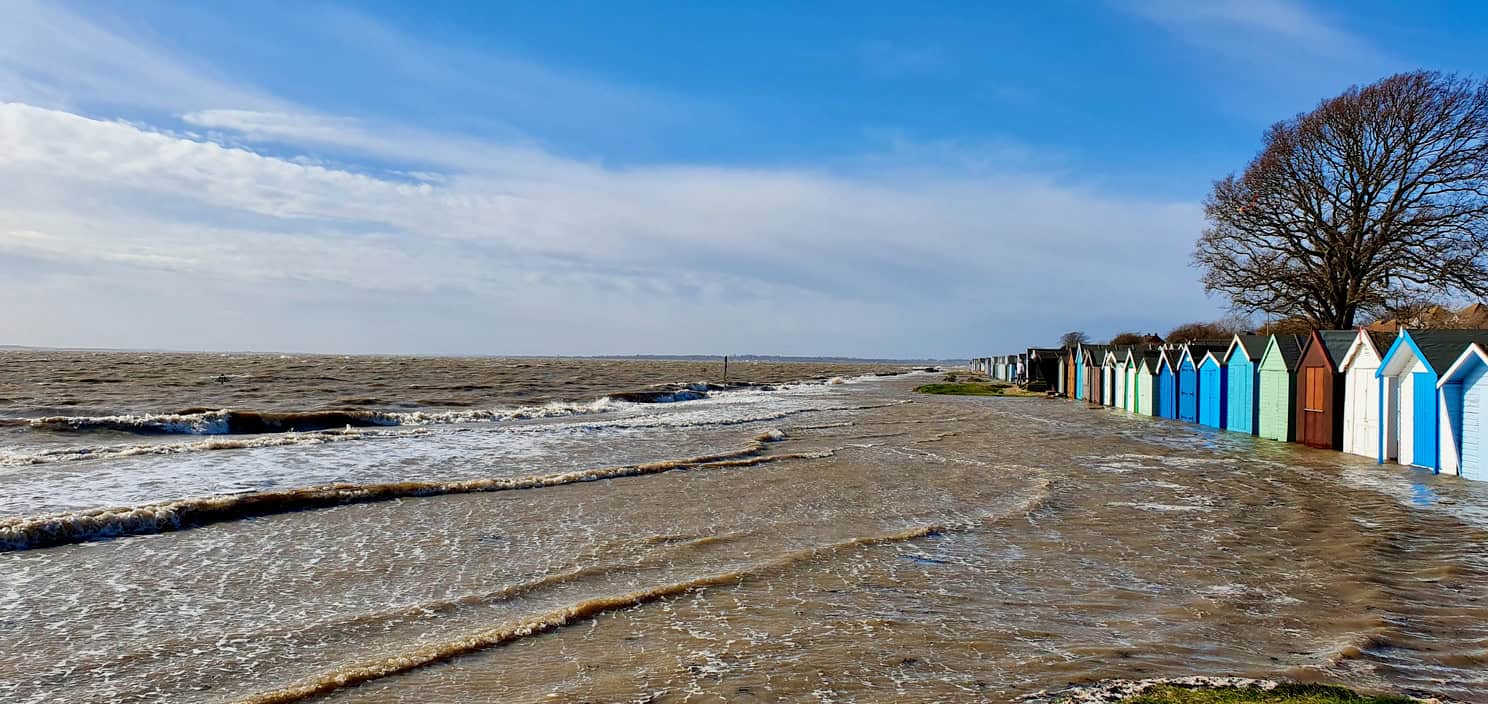
A storm surge is a rise in sea level above the predicted tide, caused by wind and low air pressure during a storm. UK news reports often call it a tidal surge. It is the same thing: the extra water the weather adds on top of the tide that was always due.
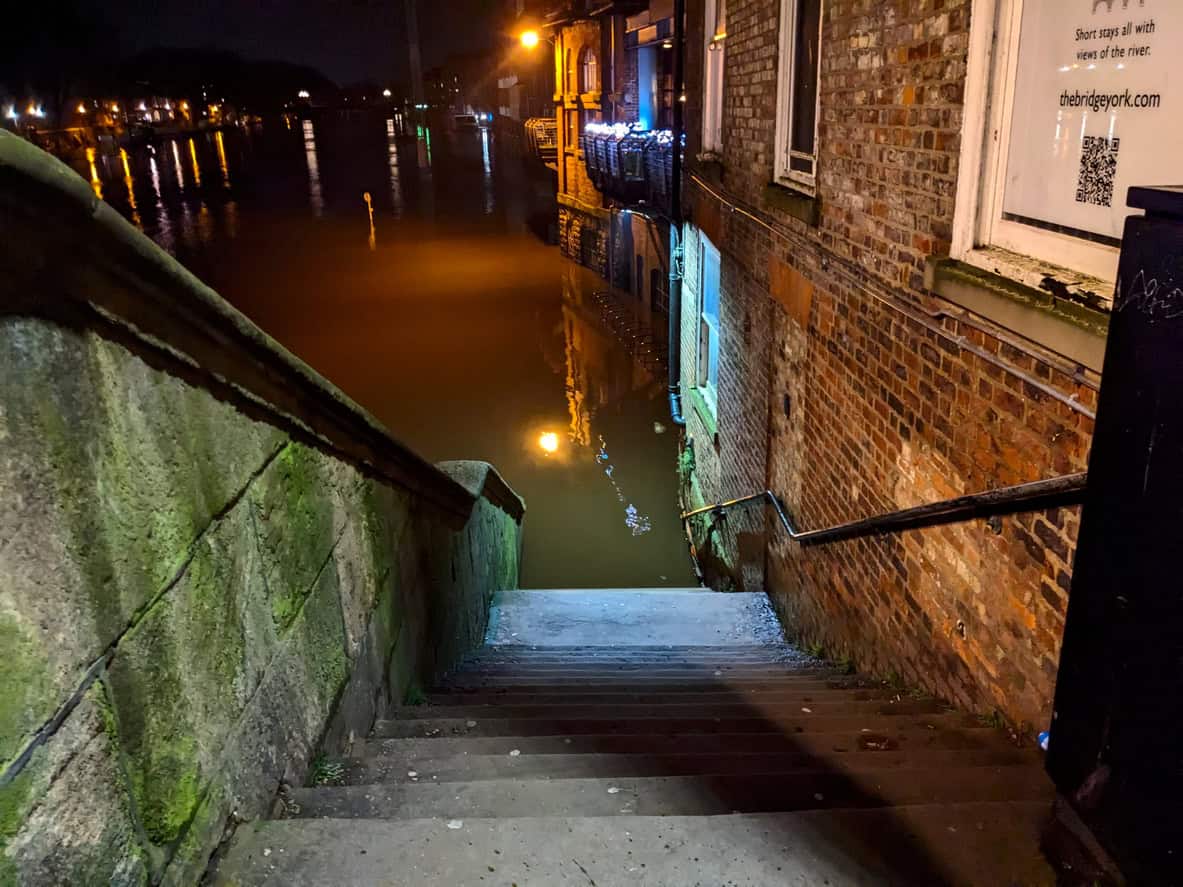
Most surges pass unnoticed. When a large one arrives near high water, though, the sea can climb past the level the defences were built for, over walls and banks that held through every ordinary winter, and the coast floods. That is what happened on the east coast in 1953, and on a smaller scale in December 2013.
The Met Office puts the pressure effect at about 1 cm of sea level for every millibar the pressure falls. A deep depression can lift the sea by half a metre on its own.
For anyone buying, building or extending on the coast, the surge is a design number. It sets the extreme sea level that a flood risk assessment for planning has to design floor levels, access and evacuation around, and it is the reason a house behind a sea wall can still sit in Flood Zone 3.
What is a storm surge?
A storm surge is the difference between the sea level a tide gauge actually records and the level the tide tables predicted. Tides are astronomical and can be forecast years ahead from the positions of the moon and sun, while the surge is the weather's contribution, different for every storm and predictable only a few days out.
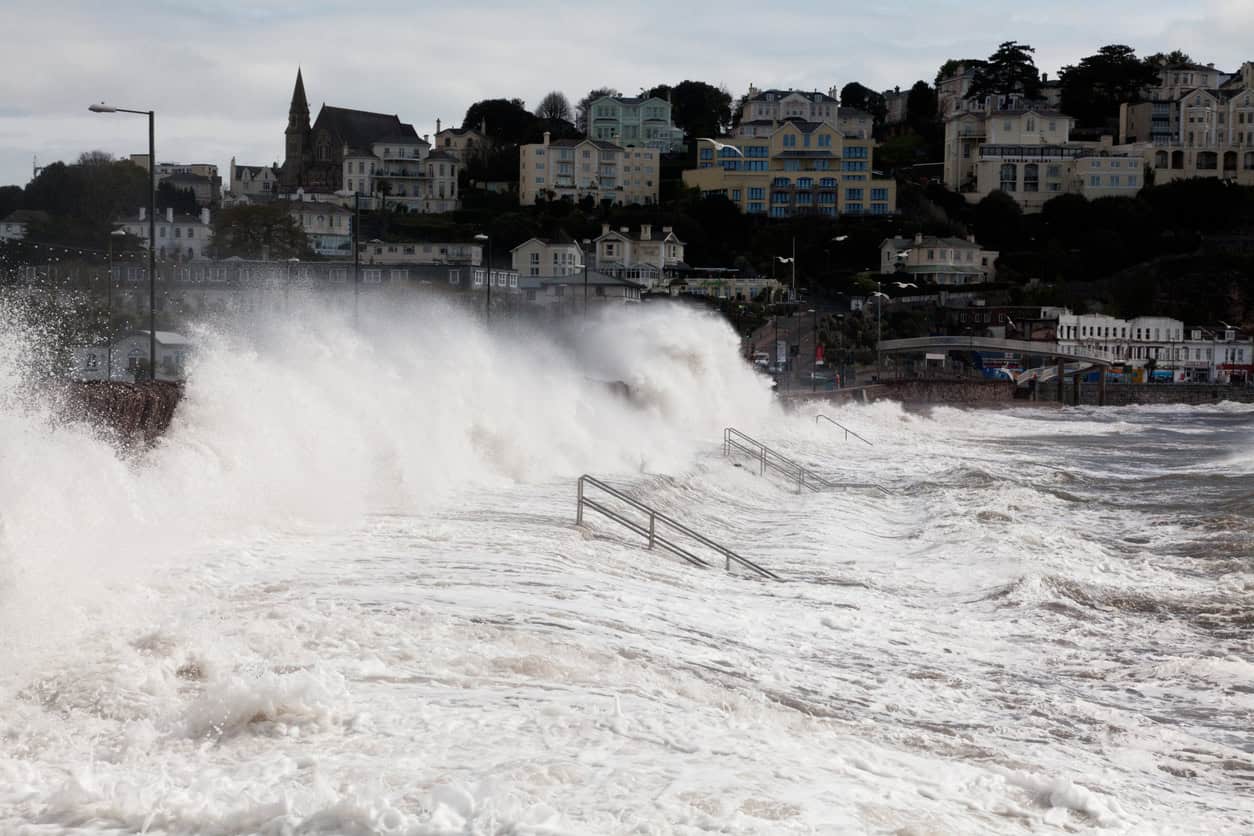
The National Tidal and Sea Level Facility records surges of more than 3 m in European seas and up to 8 m in tropical areas, where hurricanes and cyclones drive them. A surge can last from a few hours to several days and cover hundreds of square kilometres of sea, and that scale is what separates it from a single large wave: the whole sea surface stands higher, and stays higher, for as long as the storm keeps pushing.
Surges also run the other way. A negative surge, where wind pushes water away from the coast, can leave the sea well below the predicted tide. It can strand boats in shallow channels. It floods nothing.
What causes a storm surge?
A storm surge is caused mainly by wind driving water towards the coast. Low air pressure lifts the sea surface as well, and shallow water and narrowing coastlines concentrate whatever the weather supplies. Three things set the size:
- Wind. The main driver. A strong onshore wind blowing over a long stretch of sea drags the surface water with it and piles it against the coast. NTSLF attributes roughly two thirds of a typical skew surge to wind and one third to pressure.
- Low pressure. Air pressure presses down on the sea. Under a deep depression the sea rises by about 1 cm for each millibar of pressure drop, the inverse barometer effect described by the Met Office. The 964 hPa depression of January 1953 raised sea level by around half a metre through pressure alone.
- The shape of the sea and the coast. Shallow water lets the wind pile water up far more effectively than deep ocean does, and bays, estuaries and coasts that narrow towards a dead end concentrate it further, so a surge grows as it is driven into a tightening basin.
The fastest-deepening storms, the ones the press calls a weather bomb, bring the pressure fall and the wind together, which is why they so often come with coastal flood warnings.
Why is the North Sea so exposed to storm surges?
The North Sea is shallow, and it narrows towards the south. A northerly gale drives water down a basin that gets shallower and tighter as it goes, until it meets the Straits of Dover and the Thames estuary, where it has nowhere else to go.
Earth's rotation deflects that moving water to the right, which on the North Sea means towards the British east coast. The surge then travels south along the coast as a long wave over several hours, so a town in Yorkshire feels the peak well before one in Essex.
In 1953 the sea breached the spit at Spurn Head in the afternoon of 31 January. Canvey Island's sea walls gave way soon after midnight. The same surge took roughly nine hours to travel between them.
The Met Office's account of that night tracks the surge from Spurn Head through Lincolnshire, round The Wash, past Felixstowe and Harwich by midnight and into the Thames (Met Office, 1953 east coast floods). The full account, and the warning that never travelled down the coast with the water, is in the 1953 North Sea flood article.
The west coast gets surges too, from the Irish Sea into Liverpool Bay and the Solway, and up the Bristol Channel. The largest recorded there are smaller than the biggest North Sea events. The tides they ride on are among the largest in Europe, which makes timing just as critical.
Storm surge, storm tide, tidal surge and skew surge
A storm surge is the rise the weather adds. A storm tide is that surge plus the predicted tide, and a tidal surge is simply the everyday name for a storm surge. Skew surge compares the highest observed and highest predicted water at a single high tide. The four turn up in forecasts, flood risk reports and the news, and they are often mixed up.
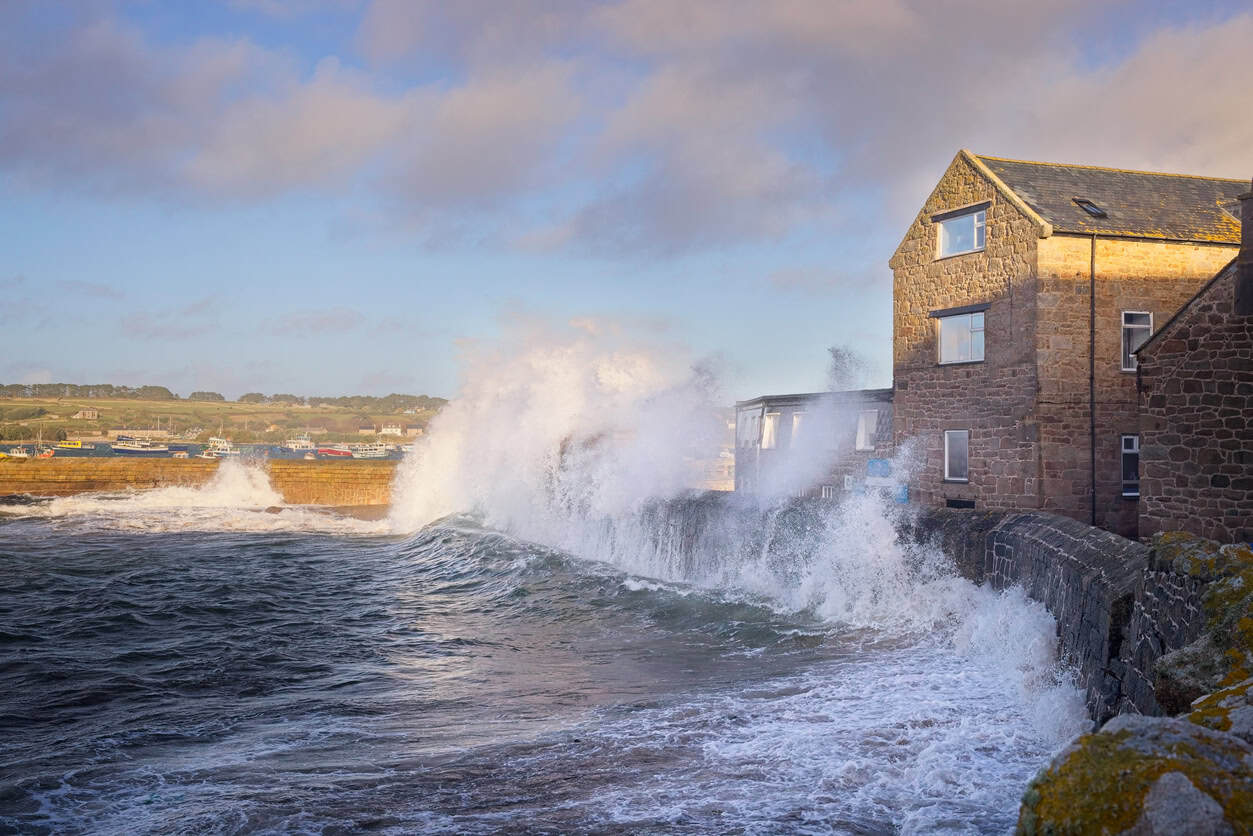
The surge and the tide together make the still water level, the level the sea would sit at if the waves stopped. Waves ride on top of that. A defence can hold the still water level and still let water through, if waves throw spray and green water over the crest. That is wave overtopping. If the defence itself fails, the full storm tide flows through the gap: that is a breach, and it is the faster and deeper of the two.
| Term | What it measures | Where you meet it |
|---|---|---|
| Storm surge | The rise in sea level caused by the weather, above the predicted tide | Met Office and NTSLF forecasts |
| Tidal surge | The same thing, in everyday UK use | News reports and everyday speech |
| Storm tide | The predicted tide plus the surge: the total still water level | Design levels in flood risk assessments |
| Skew surge | The highest observed water level in a tidal cycle minus the highest predicted tide in that cycle, whenever each occurs | Extreme sea level statistics |
| Negative surge | A fall in sea level below the predicted tide | Shipping warnings |
Specialists prefer skew surge because it compares one high water with another. A surge measured hour by hour can peak at low water and look dramatic on a graph while flooding nothing. Flooding happens at high water, and skew surge is measured there too.
Why does the timing of a storm surge matter?
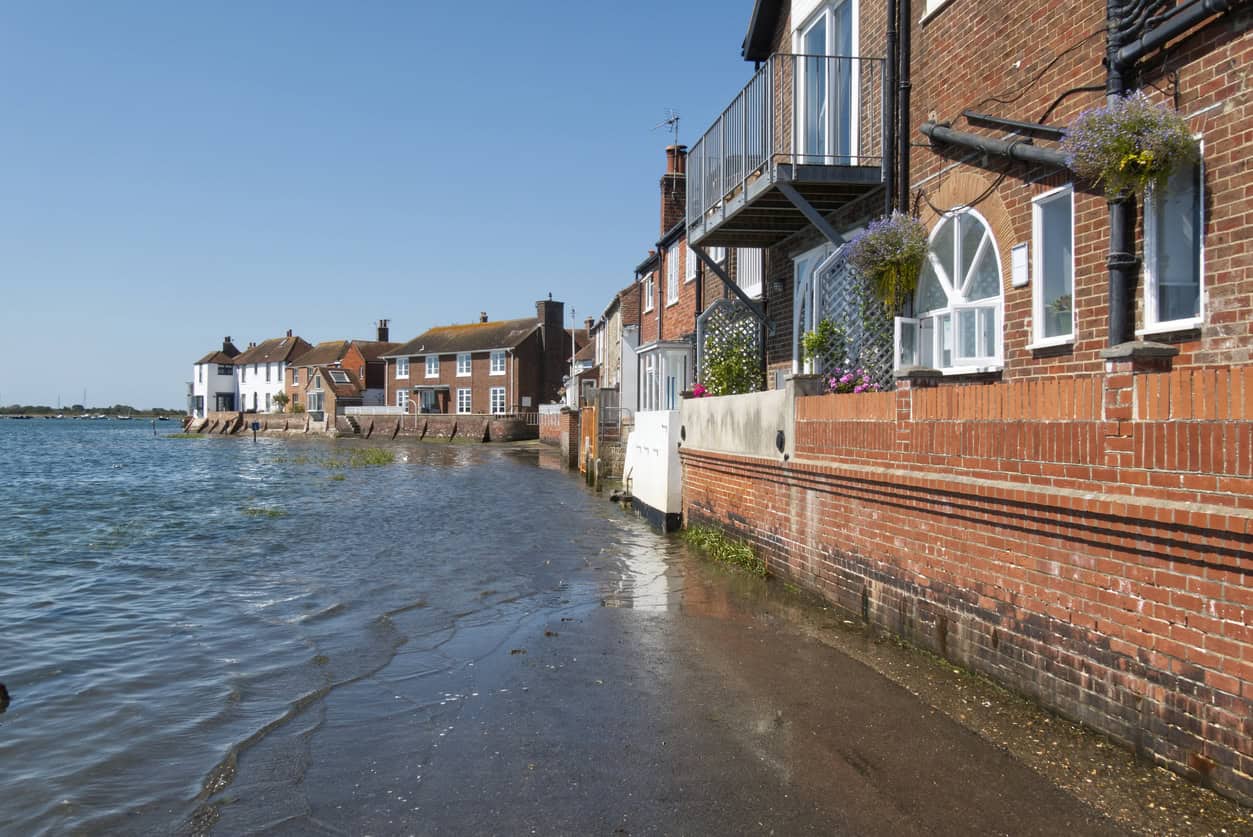
In a country with large tides the same surge can be harmless or catastrophic depending on when it arrives, and the Met Office notes that a difference of just a couple of hours can decide whether an area floods. On the east coast the tide can rise or fall several metres in six hours, so a surge peaking at low water may pass unnoticed, while the same surge at high water tops the defences.
The comparison between 1953 and 2013 shows it. A 2015 study in Frontiers in Marine Science found the 1953 skew surge was more than a metre larger than the 2013 one in the southern North Sea, around 2.4 m against about 2 m at Lowestoft, for example. Yet the 1953 tides were unremarkable, with predicted tides 0.3 to 0.9 m below the year's largest, and the surge peaked after high water. In 2013 a smaller surge peaked one to two hours before high water on a bigger spring tide. At Immingham, King's Lynn and Whitby the sea in 2013 reached higher than it had in 1953. In 2013, timing beat size.
The biggest surge does not produce the highest sea. A modest surge on a large spring tide can beat a record surge on a small one.
Major UK storm surges
Two events define how the UK thinks about surges. The 1953 surge killed 307 people in England and 19 in Scotland, and more than 2,500 around the North Sea. Sixty years later the December 2013 surge matched or beat its water levels at several gauges, and no one in the UK died from the flooding.
| Measure | 31 January to 1 February 1953 | 5 to 6 December 2013 |
|---|---|---|
| Deaths in the UK | 326 (307 England, 19 Scotland) | None from flooding (two from high winds) |
| Properties flooded | About 24,000 | About 2,800 (an early government count gave 1,400) |
| Places where defences failed | About 1,200 | Fewer than 50 |
| Warnings | No public warning system | Over 160,000 homes and businesses warned |
| Properties protected by defences | Not recorded | Up to 800,000 |
| Evacuation | About 30,000 people displaced | About 18,000 properties evacuated |
Sources: Met Office; written ministerial statement on coastal flooding, 10 December 2013; Wadey et al. (2015).
What separated the two nights was everything built after 1953: the warning service, the rebuilt walls and, in London, the Thames Barrier, which closed in December 2013 against the highest water it had faced since it began operating in 1982.
How are storm surges forecast and warned?
The UK's surge forecasts come from UK Coastal Monitoring and Forecasting, a service the Met Office runs and the Environment Agency funds, with the National Oceanography Centre's tide gauge network and Cefas WaveNet feeding it live data (Met Office). The chain from forecast to warning runs like this:
- The surge model runs. A tide-surge model is driven by the Met Office's weather ensemble, MOGREPS-G, four times a day. The ensemble surge forecast gives 36 versions of the surge for each tide gauge site, looking six days ahead.
- The forecast is turned into risk. The Flood Forecasting Centre, a Met Office and Environment Agency partnership, assesses the coastal flood risk and issues a five-day Flood Guidance Statement to emergency responders.
- Warnings go out. The Environment Agency, not the Met Office, issues flood alerts, flood warnings and severe flood warnings to the public. The split is covered in who actually issues flood warnings.
- Defences close. Tidal gates and barriers shut ahead of the peak. The Thames Barrier's controllers can identify a dangerous tide up to 36 hours ahead.
Ensemble forecasting is what gives the lead time. Thirty-six runs on slightly different weather show how likely a dangerous surge is, where a single forecast would only say yes or no. None of this existed in 1953.
Storm surges and rising sea levels
Sea level rise leaves the surge itself much the same size and raises the base it sits on, so the same storm reaches higher water every decade. A surge that topped out half a metre below a wall crest in the 1990s will come closer to it now. Nothing about the storm has to change.
The Environment Agency's climate change allowances set how much rise a flood risk assessment must design for. For the Thames and Anglian areas the cumulative allowance from 2000 to 2125 is 1.20 m at the higher central level and 1.60 m at the upper end. Sea level has no central allowance, only those two, and the credible maximum scenario, H++, allows for 1.9 m of rise by 2100.
By 2125 the upper end allowance puts the sea around the Thames 1.60 m higher than it was in 2000, before any surge is added on top.
The rise measured so far is set out in sea level rise in the UK, and which allowance applies to which development, over what lifetime and at which percentile, is in climate change allowances for flood risk assessments.
What a storm surge means for a coastal site
For a home or a planning application, the surge becomes a design sea level, a flood zone and a set of planning tests, and each of them decides what can be built and how high its floors must sit. A flood risk assessment for a tidal site works through them in order:
- The design sea level. The extreme still water level for a 1 in 200 (0.5%) annual chance event, raised by the sea level rise allowance for the development's lifetime: 100 years for housing.
- The flood zone. Flood Zone 3 from the sea is land with a 1 in 200 or greater annual chance of flooding, drawn as if the sea defences were not there. A house behind a sea wall can be in it.
- Overtopping and breach. What happens if waves come over the wall, or if the wall fails? Planning guidance names both as residual flood risk and warns that land behind a defence can flood rapidly, deeply and with little warning if a defence is breached.
- Floor levels. Finished floor levels are set against the design level in metres above Ordnance Datum, with freeboard.
- Access and refuge. Safe access and egress to dry land, and where a breach could arrive too quickly to escape, an internally accessible place of safety above the flood level.
- The Sequential Test. New development in tidal Flood Zone 3 normally has to show there are no reasonably available sites at lower risk. See Sequential and Exception Tests.
Those tests carry weight at decision stage. The August 2026 National Planning Policy Framework says that where flood risk exists, development should be refused unless it will be safe throughout its lifetime and any residual risk can be safely managed (policy F7). Planning practice guidance adds that the most vulnerable uses should go on upper storeys, and that emergency plans alone will not mitigate residual risk.
A ground floor below the design tidal level, or bedrooms that a breach could flood faster than anyone can leave, is the kind of design that draws an Environment Agency objection and a refusal.
A buyer faces the same questions. The stakes are insurance, mortgage lending and resale. A flood risk survey when buying a house answers what the surge level means for that property, defence by defence.
Coastal site behind a sea wall?
Consultants set the design sea level, test overtopping and breach, and set out the lifetime safety evidence the Environment Agency looks for.
Get a flood risk assessment quoteHow Unda assesses tidal flood levels
Unda prepares flood risk assessments for sites on the coast and the tidal rivers of England and Wales. The work covers the extreme sea level and its climate change allowance, a review of the defence in front of the site and its condition, overtopping and breach scenarios, and floor levels and refuge set against them. Where people need to leave before the peak, Unda writes a flood warning and evacuation plan tied to the Environment Agency's warning service. How the different defence types behave is covered in sea defences, and the wider coastal picture in what is tidal flooding.
Frequently asked questions
What is the highest storm surge recorded in the UK?
The 1953 surge, and no surge measured on the east coast since has matched it. Reconstructions put its skew surge at around 3 m at Herne Bay and 2.7 m at Great Yarmouth. Among measured gauge records, the largest skew surge on the National Tidal and Sea Level Facility's east England list is 1.91 m at Lowestoft on 21 February 1993.
What is the difference between a storm surge and a tsunami?
A storm surge is driven by weather: wind and low pressure raise the sea over hours. A tsunami is driven by a sudden movement of the seabed or a landslide, usually an earthquake, and arrives as a series of fast, very long waves with no storm overhead. Both flood the coast, but only a surge can be forecast days ahead from a weather model.
Can a storm surge happen on the west coast of the UK?
Yes. The National Oceanography Centre reported a surge of 0.75 to 1 m across a large part of the Irish Sea on 3 January 2014. In December 2013 the sea at Liverpool reached 0.9 m higher than it had in 1953, while the largest skew surge on NTSLF's west England list belongs to Heysham, at 1.63 m in February 1988.
How much warning is there before a storm surge?
Days, for a large one. Before the December 2013 surge the ensemble forecast flagged a low risk seven days ahead and a significant risk five to six days ahead, according to the 2015 study of the event. Environment Agency flood warnings follow nearer the time, as the forecast peak level firms up.
Can a storm surge flood a river inland?
Yes, on tidal rivers. A surge travels up an estuary as far as the tide does, which on the Thames is Teddington. It also stops rivers draining: when the sea is high, outfalls are held shut, a condition called tidal locking, and river water backs up behind them.
Does a storm surge need a storm at the coast?
No. Part of a North Sea surge can be generated by a storm far to the north and travel down the coast as a long wave. In 1953 that external surge alone raised predicted levels by about 0.7 m, according to the Southern North Sea Sediment Transport Study, so a stretch of coast can see the sea rising under a moderate wind.
About the author. Edward is a co-founder and Director of Unda with 20+ years in flood risk and drainage, and a national-press commentator on flooding. Unda has been trading since 2014, is a CIWEM Business Partner with CIWEM member and chartered (C.WEM MCIWEM) consultants, and has delivered 5,000+ flood risk assessments and drainage strategies across England and Wales.
Edward Bouët · BSc (Hons)
Latest news

One of our experienced Flood Risk Consultants will get back to you within 60 minutes
