Boscastle Flood 2004: Causes, Impacts and What It Changed
Estimated reading time 25 minutes
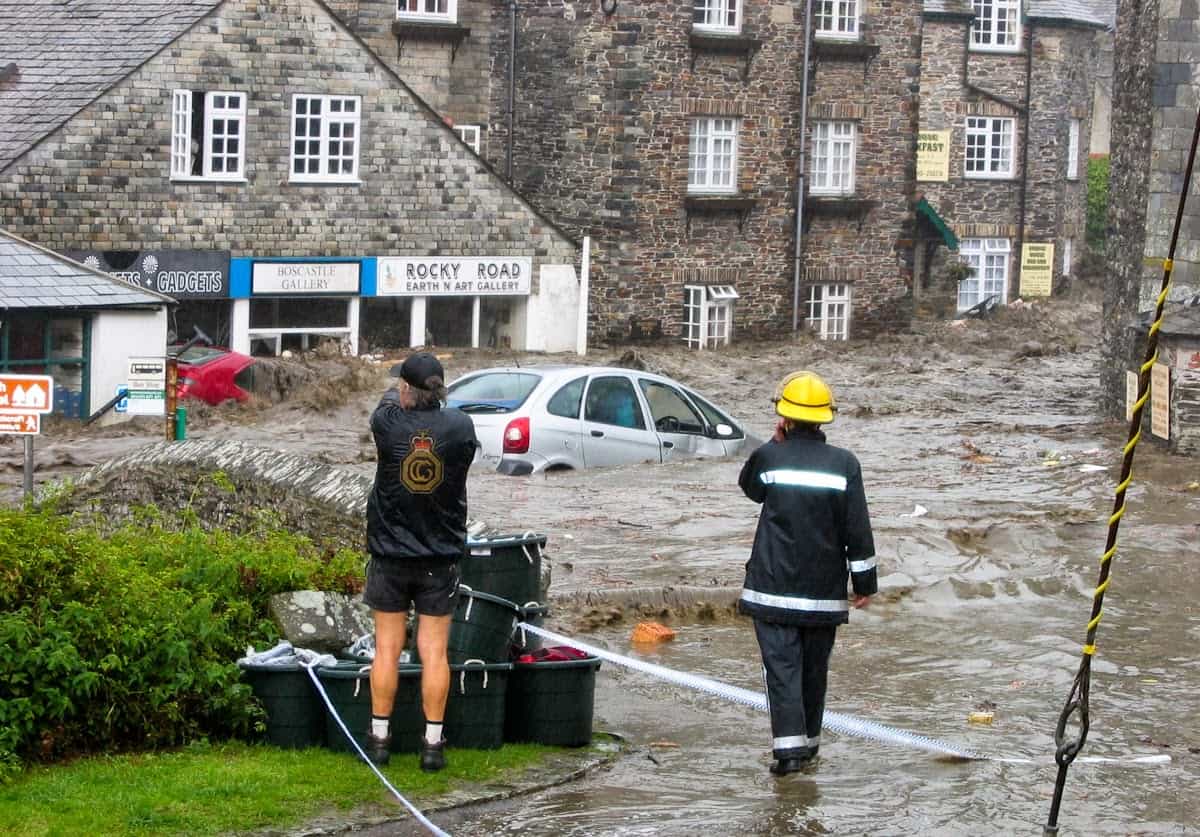
On Monday 16 August 2004 a line of thunderstorms stalled over the moors above Boscastle and put more than 180 mm of rain into a catchment of barely 20 square kilometres. The Boscastle flood that followed destroyed four properties, flooded more than seventy, carried around 115 vehicles down the valley towards the harbour and brought seven helicopters over a Cornish village at dusk. Nobody was killed. Twenty-two years on it remains Britain's reference case for what a small, steep catchment can do when the rain falls in the wrong place at the wrong intensity.
It is also the most misquoted flood in the country. The figure repeated almost everywhere — 89 mm of rain in an hour at Boscastle — is not what happened at Boscastle. The village itself caught perhaps 30 to 50 mm. The extreme totals fell three kilometres upstream, on ground most visitors never see, and arrived in the village as river flow. That distinction is the event in miniature, and it is why a site can sit under a dry street and still be at severe risk.
The rain that destroyed Boscastle did not fall on Boscastle. Otterham recorded 200.4 mm across the day and Lesnewth 184.9 mm; the village took a fraction of either.
What follows is what caused the flood, what it did, what was built afterwards, and what a practising consultant takes from it now, including the finding that has aged better than any other and that English modelling guidance still does not reflect.
What caused the Boscastle flood?
The Boscastle flood was caused by an intense, almost stationary convective storm falling on already saturated ground in a steep, impermeable catchment with no floodplain to absorb it. Each of those four conditions was unremarkable on its own. Together, over about five hours, they turned two small watercourses into a torrent carrying boulders.
A shallow low in the western Channel, an upper trough and warm, moist Atlantic air met the high ground of Bodmin Moor. Convective rainfall fired along a sea-breeze convergence line near the coast and, instead of drifting east, the cells regenerated in place. The clearest account of what that meant on the ground is Stephen Burt's rainfall analysis in Weather, which remains the definitive record of the storm: 85.7 mm in a single hour at Lesnewth from 1450 UTC, 181.4 mm over four hours, and a five-minute burst equivalent to more than 240 mm an hour. For twenty seconds around 1534 UTC the gauge registered a rate above 500 mm an hour. Four of the ten nearest gauges recorded less than 3 mm the same day.
The catchment did the rest. The Valency and the Jordan drain roughly 20 square kilometres of Carboniferous slate and siltstone, effectively an impermeable surface once the soil is full, with slopes steeper than one in eight and thin soils already at capacity after a wet fortnight. Percentage runoff, which for a rural catchment of this type would normally sit somewhere in the thirties, had to be raised to 85–95% in HR Wallingford's post-event analysis before the modelled flows matched what had been observed. Almost every drop that fell ran off.
Recorded at Lesnewth, three kilometres upstream, onto ground already saturated
Thin soils on slate and siltstone, at capacity, so almost nothing infiltrated
Flow concentrated into the main channels within tens of minutes of the rain starting
The Jordan joins the Valency in the centre of Boscastle, in a valley with no floodplain
Modelled rapid blockage raises upstream levels by one to two metres in minutes
Stored water releases down the main street as a surge, faster than the natural flood peak
The result was a peak flow on the Valency, downstream of the Jordan confluence in the centre of the village, of around 180 cubic metres per second. On the Jordan itself the peak reached about 19 cubic metres per second against a culvert carrying roughly 2 when flowing full. Converting rainfall into a peak of that shape is the core of hydraulic modelling, and it is why a flood risk assessment for a planning application in a steep catchment cannot rest on flood zone extents alone. The maps show where water ends up, and the Flood Map for Planning has improved considerably at showing it. They do not show how fast it arrives, and in a catchment with a time of concentration measured in tens of minutes, speed is the hazard.
HR Wallingford put the flood at an annual exceedance probability of about 0.25%, a 1 in 400 year event, with other analyses of the same data landing between 1 in 350 and 1 in 450, a spread worth remembering whenever a single flood return period is quoted to three significant figures. The rainfall was rarer than the flood: the three-hour fall has been assessed at around 1 in 1,300. Those are not the same number, and conflating them is one of the commonest errors in flood writing. Rare rain produces a rarer flood only when the catchment is primed to respond to it.
How the flood unfolded
The flood developed over about four hours and did most of its damage in one. Heavy rain set in over the upper catchment around lunchtime, the Valency was level with its banks by mid-afternoon, and the destructive surge came shortly after four o'clock when a debris blockage failed. The hydrograph for an event like this has no shoulder to speak of, which is exactly what makes it dangerous.
| Time | What happened | Why it mattered |
|---|---|---|
| ~13:15 | Torrential rain over the upper Valency and Jordan; convective cells regenerating in place | Runoff begins on ground already at capacity |
| 14:50–15:50 | Lesnewth gauge records 85.7 mm in the hour; peak short-duration rates above 240 mm/hr | The rarest part of the storm, three kilometres from the village |
| ~15:30 | River level with its banks through the village; first cellar and garden flooding | Roughly 45 minutes between the rainfall peak and the flood crest |
| 15:45 | The Valency overtops; debris begins to accumulate beneath the bridges | Conveyance starts to fall as the openings choke |
| ~16:00 | The blockage at the lower bridge fails; a surge passes down the main street | The single most destructive moment of the event |
| 16:10–17:00 | Velocities of around 4 m/s through the village; vehicles, trees and masonry in transport | Depth-velocity hazard well beyond any safe-access threshold |
| 17:00 onward | Major incident declared; helicopter rescue continues into the night | Response, not design, is what kept the death toll at zero |

What were the impacts of the Boscastle flood?
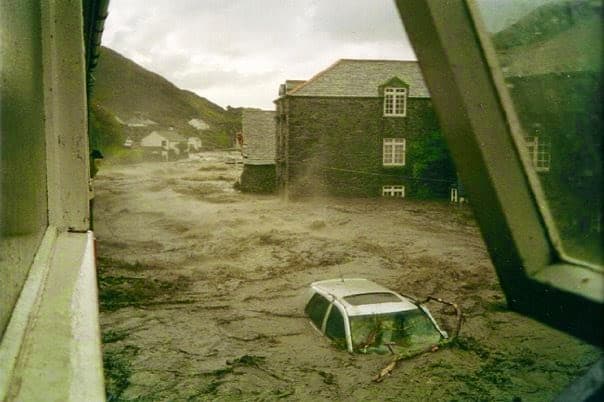
More than seventy properties were flooded in Boscastle and four were destroyed, with around 115 vehicles carried down the valley, many of them into the harbour. The Environment Agency put the volume of water that passed through the village at two million tonnes and the debris later cleared at roughly 4,000 tonnes. Two further properties were destroyed at Crackington Haven and around forty more flooded across Canworthy Water, Bude, Helebridge and Crackington Haven, which is routinely forgotten. This was a north Cornwall event rather than a Boscastle one.
- Properties. Over 70 flooded in Boscastle, four destroyed there and two more at Crackington Haven, with around 40 further properties flooded elsewhere in north Cornwall.
- Vehicles. Around 115 swept away, according to the Environment Agency's own account. Lower figures in circulation are snapshot counts, not totals.
- Water and debris. Two million tonnes of water through the village; about 4,000 tonnes of debris recovered afterwards.
- Sediment. Material in transport ranged from fine silts to individual boulders up to a metre across.
- Casualties. None. No deaths and no serious injuries, in an event with depth-velocity conditions that were lethal by any published hazard rating.
- Cost. No primary source quantifies the total. Widely quoted damage figures cannot be traced to the Environment Agency or to the post-event investigations, so we do not repeat them.
The material moved deserves a moment's attention, because it is the part that carries across to design work. A watercourse modelled as clear water conveying a design flow is not the watercourse that ran through Boscastle. The Phase 2 investigation records boulders, cars, trees, fencing and masonry all in the flow at once.
How did everyone survive?
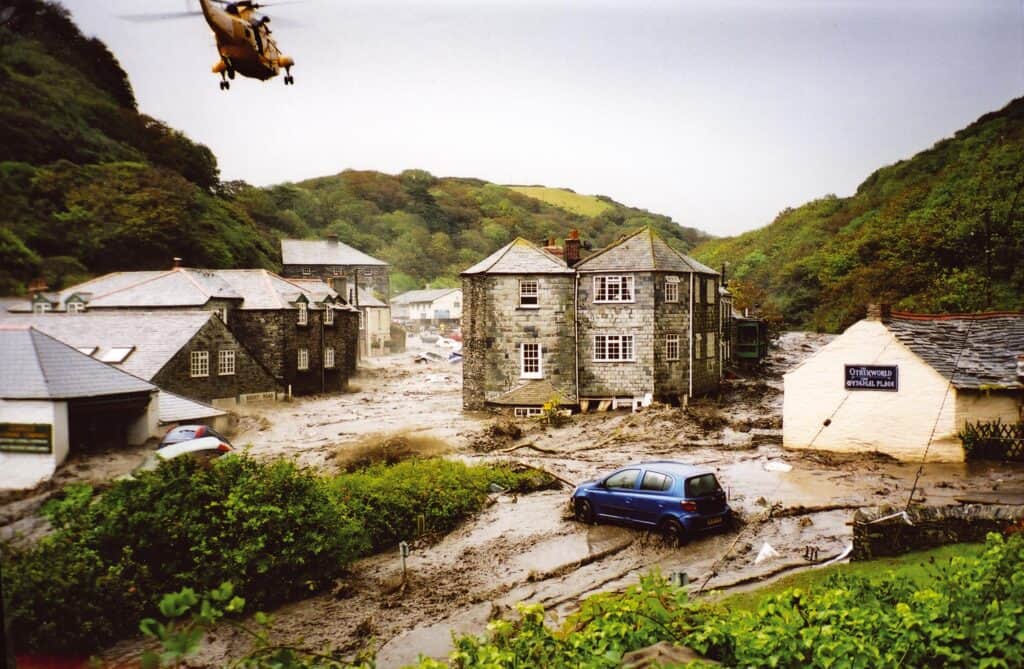
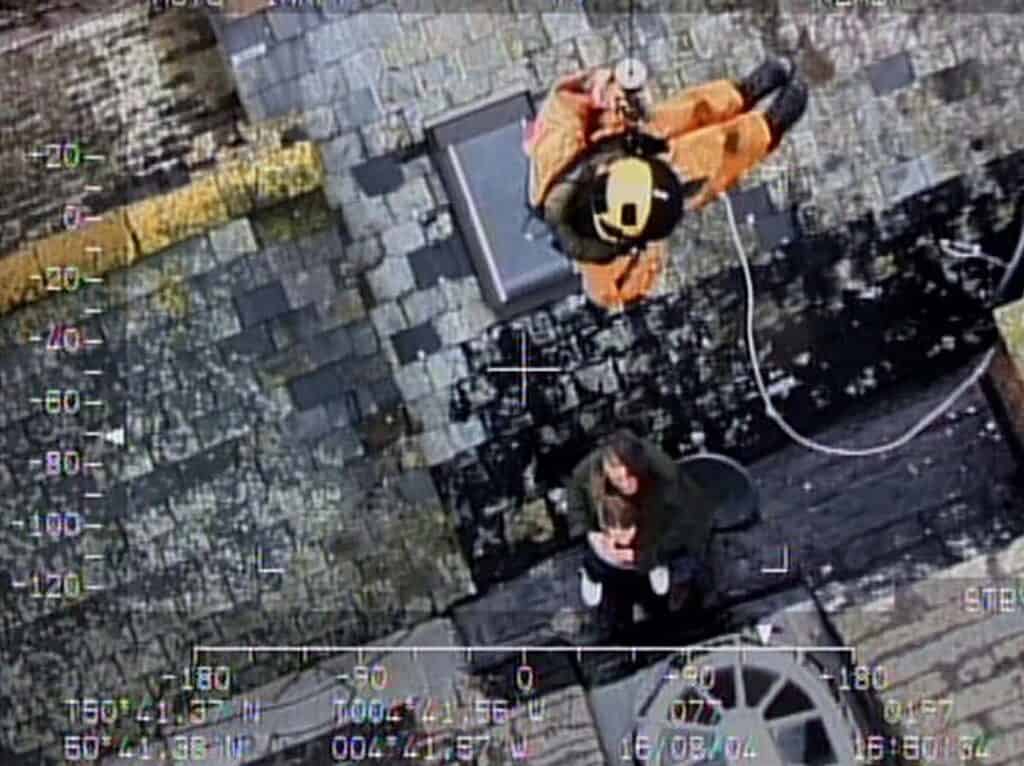
Nobody died at Boscastle, and the reasons are worth separating from luck. The flood arrived in daylight; many of the people at risk were in commercial premises and guesthouses with upper floors; and the emergency response was exceptional. Seven military and coastguard helicopters worked between the valley walls into the evening, winching people from roofs and upper windows.
Who responded
The scale of the operation is the reason the casualty figure is what it is. It was not a designed outcome.
- Air. Seven military and HM Coastguard helicopters, drawn from bases across the South West.
- Coastguard. Rescue teams from Boscastle, Port Isaac, Bude, Polzeath and St Austell.
- Sea. RNLI lifeboats from Port Isaac, Bude and Padstow.
- Ground. Police, fire and ambulance services, alongside members of the public.

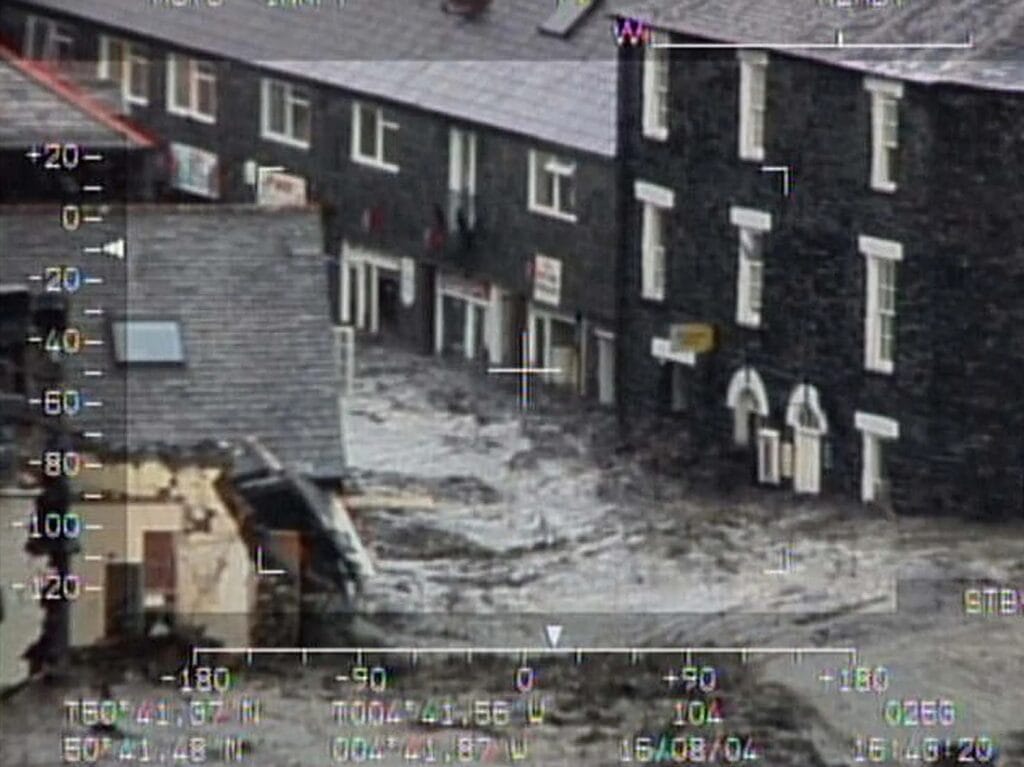
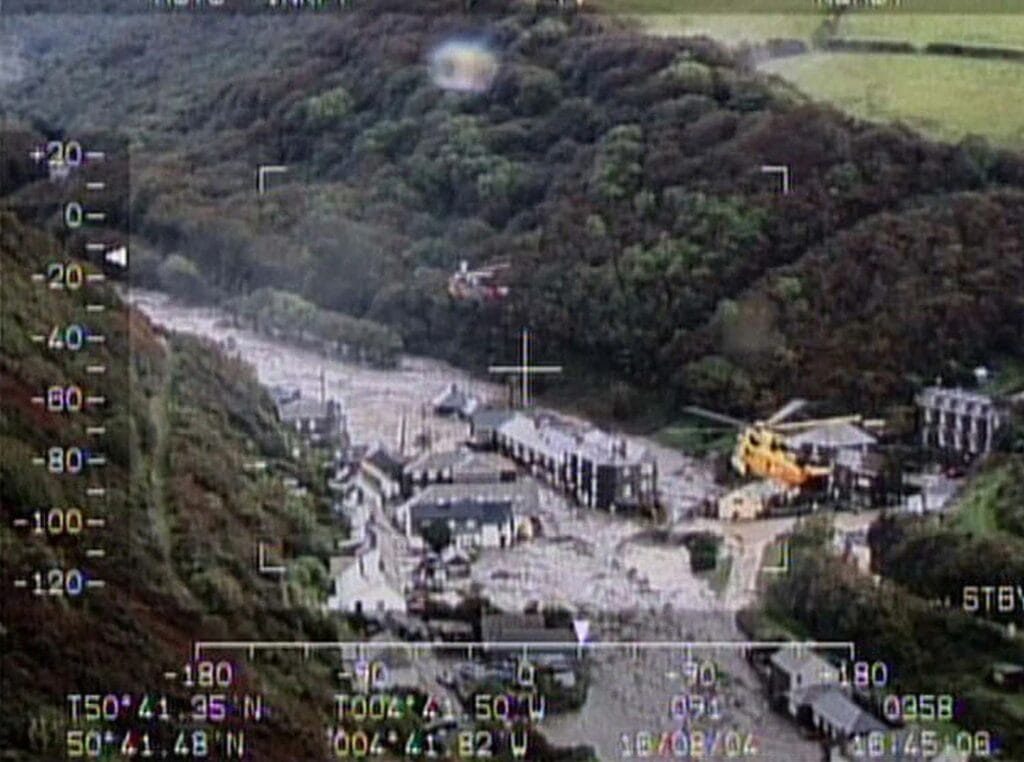
It is the part of the story told most often and the part that transfers least well. The same hydraulics arriving at three in the morning, in winter, in a village of single-storey dwellings without helicopter access, produce a different casualty figure. That asymmetry is what the planning system is reaching for when it asks about safe access and egress rather than about depth alone, and it is why a flood warning and evacuation plan has to be tested against how quickly the water actually arrives.
The bridge that had to be blocked
The finding from Boscastle that has aged best is barely mentioned in the popular accounts. HR Wallingford could not reproduce the observed water levels with an unobstructed channel. To match the wrack marks and the eyewitness record, the B3263 road bridge had to be represented as substantially obstructed by debris.
The main B3263 road bridge had to be modelled as substantially blocked by flood-borne debris.
HR Wallingford, report HRPP341, for the Environment Agency
They tested the alternative explanation and largely rejected it. Had the surge come from failures of trash dams upstream, water levels would have risen by 0.055 m for a one-metre dam and 0.159 m for a two-metre one — nowhere near the metre-plus rises observed within minutes. Local blockage at the bridge was the likelier mechanism, and the modelled consequence of rapid blockage was an upstream rise of between one and two metres over a period measured in minutes.
The most destructive feature of the Boscastle flood was a structure doing what structures do in a debris-laden flow. Channel capacity was never the binding constraint. The opening was.
England still does not publish blockage figures
Twenty-two years later, English guidance asks modellers to consider blockage without telling them what to assume. The Environment Agency's guidance on using modelling for flood risk assessments requires post-development models to consider the impact of potential blockage of significant structures, and gives no percentages, no defined scenarios and no method. The Blockage Management Guide behind it is deliberately non-prescriptive: a risk-based asset management document rather than a modelling standard.
Wales handles it differently. Natural Resources Wales publishes tabulated blockage proportions in guidance note GN43 and ties them to defined design events.
| Scenario | Culvert | Bridge |
|---|---|---|
| Low | 30% | 5% |
| Medium | 67% | 25% |
| High | 100% (95% usually adopted, to retain a minimum opening) | 80% |
Neither approach is self-evidently correct. A national percentage applied without judgement would be its own kind of error, and NRW says as much: local knowledge and engineering judgement should vary the figures where the location warrants it. But an assessor in England is left to invent a defensible assumption every time, and that assumption is what determines the answer. Where a scheme's safety depends on a bridge or a culvert staying open, the blockage scenario should be stated, justified and tested rather than left implicit. That is the standard our hydraulic flood modelling service works to, and it sits with what the Environment Agency's river modelling technical standards now expect a submission to demonstrate. The choice of software matters far less than the choice of scenario, whatever the modelling package in use.
The mechanism has not gone away. The Section 19 investigation into flooding at Bloxham in Oxfordshire during Storm Bert, published in January 2026, found up to 35 properties flooded internally with culvert and trash screen blockage among the primary causes. Different catchment, different rainfall, same failure, and a reminder that this applies to ordinary watercourses at least as much as to designated main rivers.
What was built at Boscastle, and did it work?
The scheme completed in 2008 treated the two watercourses separately, and its logic was to remove constrictions and intercept debris rather than to hold water back. On the Valency the channel was widened and deepened, the lower bridge was replaced with a structure that lets water and debris pass beneath, and the car park that supplied so many of the 2004 vehicles was raised and moved away from the river.
- Valency channel. Widened and deepened to increase conveyance, with a walling design guide that retained surviving authentic stone walls through the conservation area.
- Lower Bridge. Replaced in December 2007 and brought into use in 2008, with a clear span that passes debris instead of catching it.
- Car park. Raised and repositioned away from the channel, removing the largest single source of floating debris.
- Jordan relief culvert. A flood relief culvert behind Marine Terrace with a dissipation chamber, taking pressure off the original undersized crossing.
- Stone catcher. Installed above Paradise Road to intercept coarse material before it reaches the constricted section.
- Tree management. A new regime in the Valency valley, aimed at the debris supply itself.
Costs are quoted inconsistently because the scopes differ. The Environment Agency's flood defence element was around £4 million; South West Water's sewerage scheme added about £1.5 million and the district council's car park works about £580,000, giving roughly £6.08 million at Boscastle. The Agency's frequently quoted figure of more than £10 million covers Boscastle together with the wider north Cornwall works.
One number is missing from every authoritative source, and its absence matters. Neither the Environment Agency, nor the East Cornwall catchment flood management plan, nor the published engineering accounts state a design return period or design discharge for the widened channel. The "1 in 75 year" figure that circulates in revision material has no traceable origin, so it is not repeated here.
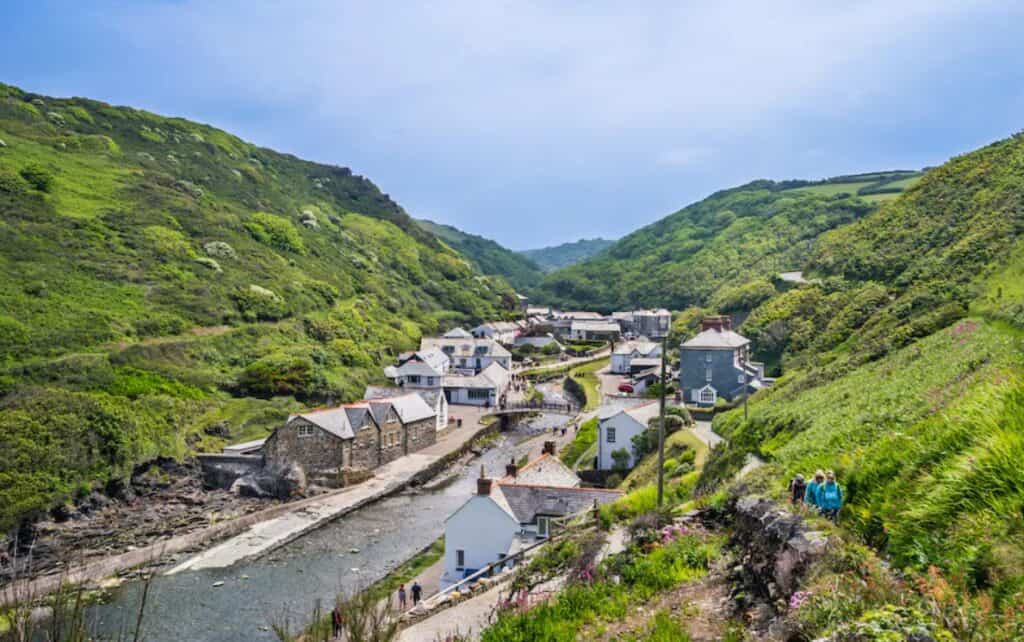
The scheme has been tested. The Environment Agency has reported that the new defences protected communities across Boscastle and north Cornwall on several occasions, notably in 2010 and 2012. The more instructive test came earlier and smaller. On 21 June 2007 about 30 mm of rain fell in an hour. The new Jordan storm culvert ran at full capacity and held. A few properties flooded to around three feet anyway — from water running down the streets because drains were blocked, not from the river.
The 2007 re-test is the lesson most often missed: the river works performed as designed, and properties flooded anyway, because the surface water system did not.
That is an exceedance problem, and it is the same one that appears on modern applications when a drainage design is sized for the rare event but never asked where the water goes once the system is full. A surface water drainage strategy that routes exceedance flows deliberately, above ground, to where they do least harm is worth more on a day like that than another pipe diameter. Pluvial flooding of that kind is now the most widespread flood source in England. It is a point that carries into how surface water is handled in planning generally, and into the wider drainage strategy a site needs.
The Agency's catchment flood management plan is candid that a residual risk remains at Boscastle, identified through the Valency Valley Tree Management Study. Which is to say the wooded valley that supplied the debris in 2004 is still upstream. Anyone assessing a site on the River Valency, or elsewhere in Cornwall's flashy coastal catchments, is assessing a defended village with a live debris source above it, and a residual flood risk that has to be described rather than assumed away. Where a lower-risk alternative site exists, that is also territory for a sequential and exception test report.
Could Boscastle happen again in a wetter climate?
Yes, and the physics points towards it happening more often. Warmer air holds more moisture, at roughly 7% more per degree of warming, but the short, violent downpours of the Boscastle type appear to intensify faster than that baseline. Met Office research using 2.2 km convection-permitting projections found extreme rainfall intensities increasing by 5 to 15% per degree of regional warming, and events exceeding 20 mm an hour becoming around four times as frequent by 2080 against the 1980s under a high-emissions pathway. That threshold was chosen because 20 mm an hour is the sort of rate surface water drainage has to cope with. The wider evidence for short-duration extremes intensifying faster than the thermodynamic baseline is set out in Fowler and colleagues' review of anthropogenic intensification.
More useful still for anyone sizing a scheme: the Met Office expects rainfall from an event that currently occurs once every two years in summer to increase by around 25%.
Being honest about the uncertainty strengthens the argument rather than weakening it. The Met Office is clear that the human-caused signal in short-duration extreme rainfall is unlikely to be clearly detectable in the observational record until at least the 2080s for summer. The case for designing to uplifted rainfall does not rest on being able to see the trend yet. It rests on the projections, and on how asymmetric the consequences of underestimating are, a point set out at more length in our piece on how increasing rainfall is changing UK flood risk.
Handling that in a submission is what the Environment Agency's peak rainfall climate change allowances exist for. Since the May 2022 update they are issued by management catchment rather than as a single national figure, drawing on the FUTURE-DRAINAGE uplift research and the 2.2 km UKCP Local projections behind it, split across a 2050s and a 2070s epoch, for the 1% and 3.3% annual exceedance probability events, at central and upper-end percentiles. They apply to site-scale drainage design and to surface water mapping in catchments below five square kilometres, which is to say the Jordan, and catchments like it, are precisely what the peak rainfall intensity allowance was written for. There is a trap worth knowing: in some locations the 2050s allowance exceeds the 2070s one, and where a development's lifetime extends beyond 2061 the higher of the two applies. Choosing the right allowance is one of the more common places a drainage submission comes unstuck.
What Boscastle means for a flood risk assessment today
The national picture has moved a long way. When the Environment Agency published its second National Assessment of Flood and Coastal Erosion Risk in December 2024, the number of English properties in areas at risk of surface water flooding rose to about 4.6 million, a 43% increase, with an 88% rise in those at the highest levels of risk. The assessment itself puts around 6.3 million properties at risk from all sources today, rising towards eight million by mid-century. The Agency was careful about why: the changes were, in its words, "almost entirely due to significant improvements in our data, modelling and use of technology". Model resolution went from 50 metres to 2 metres. The hazard did not grow. The ability to see it did.
Forecasting has changed at least as much. In 2004 the operational model ran on a 12 km grid and could not represent an individual storm cell at all. Today the Met Office's UKV runs a 1.5 km inner domain and MOGREPS-UK provides an 18-member ensemble at 2.2 km, so convection is permitted rather than parametrised in the operational configuration, a change the Met Office's role in flood management now rests on. Reviewing the event on its twentieth anniversary, the Met Office's own judgement was that the country would be much better prepared today.
The nowcasting initiative has produced several tools that support early (one hour ahead) recognition of the potential for extreme local rainfall. So, if we had a team working on nowcasting at the time of Boscastle, we'd have been able to quickly produce detailed guidance on the location, extent and timing of the imminent, high impact weather.
Professor Brian Golding · Met Office
Warning, though, has not kept pace with forecasting. The Flood Forecasting Centre, created in 2009 on the recommendation of the Pitt Review, now issues Rapid Flood Guidance, and its surface water hazard impact model gives county-scale forecasts from around six hours to three days ahead. Trials found the guidance could have been improved on nearly half of occasions, and the Centre's own strategic plan treats surface water as a capability still under development rather than a mature one. England has no property-level surface water warning service equivalent to the river and coastal flood warnings that the Environment Agency operates, and Defra's programme has not yet closed that gap. A Boscastle-type event today would be anticipated far better than in 2004. The warning still would not reach an individual front door the way a river warning does.
So what does an assessor do with all of this? Five things, none of them exotic.
- Take response time as seriously as extent. In a catchment that peaks in under an hour, the depth on a map matters less than the time between the rain and the water. Say what that time is, and design the access strategy around it.
- State the blockage scenario explicitly. Where safety depends on a structure staying open, model it obstructed, say what proportion you assumed and why, and show the consequence. Boscastle is the precedent for why an unobstructed model can be wrong by metres.
- Route the exceedance flow as well as the design storm. The 2007 event flooded properties the river works had protected. Show where water goes when the system is full, above ground, and where it ends up.
- Use the right allowance for the catchment scale. Below five square kilometres, and for site drainage, the peak rainfall allowance governs rather than peak river flow. Pick the epoch and percentile by the development's lifetime, and check the 2050s figure against the 2070s.
- Be plain about what the defences do not cover. A defended site has a standard of protection, a freeboard allowance and a residual risk above both. Where the standard is not published, as at Boscastle, say so rather than assuming one.
Planning policy already asks most of these questions, read properly. The Planning Practice Guidance defines residual risk to include breaches, blockages and exceedance of design standards; requires acceptable flood depths for access to account for flood velocities and the risk of debris in the water; and expects an internally accessible place of safety where the speed of onset would not allow time to get out. It is also blunt about the limits of paperwork.
It will not be appropriate to rely solely on emergency plans to mitigate residual risk.
Planning Practice Guidance · Flood risk and coastal change
For a site in a catchment that behaves like the Valency, that sentence is the whole argument. An evacuation plan is not a substitute for a design that survives the event. Under the flood risk policies introduced in the August 2026 NPPF, the evidence expected on lifetime safety has gone up rather than down, including where the sequential and exception tests apply.
Boscastle is remembered for the helicopters and the cars in the harbour. What has actually lasted is duller and more useful: a well-documented demonstration that a 20 square kilometre catchment can deliver 180 cubic metres per second, that the structure rather than the channel was the binding constraint, and that a defence scheme can perform exactly as designed while the streets flood anyway. Some version of those three findings turns up in most weeks of ordinary consultancy work.
If you are assessing a site in a steep or flashy catchment, or a scheme whose safety depends on a culvert or a bridge staying clear, our chartered consultants can prepare the flood risk assessment your application needs and set out the blockage and exceedance scenarios properly, rather than leaving them assumed. Speak to our flood risk consultants about the catchment you are working in.
Frequently asked questions
How many people died in the Boscastle flood?
Nobody died, and there were no serious injuries. The most commonly reported injury was a broken thumb. Given depth-velocity conditions that were lethal by any published hazard rating, that outcome owed a great deal to timing and to the response: the flood arrived in daylight, many of those at risk were in buildings with upper floors, and seven helicopters were over the valley within hours. A comparable event overnight, in winter, in single-storey housing without air access would not be expected to produce the same result.
Was the Boscastle flood a 1 in 100 year event?
No, it was considerably rarer. HR Wallingford assessed the flood at an annual exceedance probability of about 0.25%, equivalent to a 1 in 400 year return period, with independent analyses of the same data putting it between 1 in 350 and 1 in 450. The rainfall was rarer than the flood, the three-hour fall being assessed at roughly 1 in 1,300. The two figures are not interchangeable: rainfall rarity only translates into a rarer flood where the catchment is primed to respond, which at Boscastle it was.
Is Boscastle safe from flooding now?
It is substantially better protected, and it is not risk-free. The Environment Agency reports the works protecting communities across Boscastle and north Cornwall on several occasions since completion, notably in 2010 and 2012. But no authoritative source publishes a standard of protection for the widened channel, so nobody can say what magnitude of event it is designed to pass, and the catchment flood management plan records a live residual risk associated with the debris supply from the wooded Valency valley upstream. For a planning submission, that means the defences reduce the risk without removing the need to assess it.
Why is Boscastle used as a geography case study?
Because it is unusually well documented and unusually clean as a teaching example. The rainfall was captured by gauges close enough to characterise the storm, the Environment Agency commissioned a full two-phase investigation afterwards, the physical causes were textbook, the scheme that followed is well described, and no fatalities means the human story can be taught without distress. The one thing revision material consistently gets wrong is placing the extreme rainfall in the village rather than on the moor above it.
Does a flood risk assessment have to consider blockage?
In England, yes in principle but without prescribed figures. Environment Agency modelling guidance requires post-development models to consider the impact of potential blockage of significant structures, and leaves the proportions, scenarios and method to the assessor's judgement. In Wales, Natural Resources Wales publishes blockage proportions in GN43 and applies them to defined design events. The practical consequence is that an English assessment has to state and justify its own assumption, which is why an unjustified clear-water model is one of the easier things for a consultee to challenge.
Could an intense storm like this be forecast today?
The storm itself, largely yes. The 2004 operational model ran at 12 km resolution and could not represent a single convective cell; today's configuration permits convection at 1.5 km with a 2.2 km ensemble behind it, and nowcasting tools support recognition of extreme local rainfall about an hour ahead. What has not caught up is warning delivery. Surface water guidance in England is issued at county scale for responders, and there is no property-level surface water warning equivalent to the river and coastal flood warning service.
What happened to the old lower bridge?
It was replaced. The nineteenth-century arch that caught the debris in 2004 was over a hundred years old, and its narrow opening is what allowed the blockage to form and then fail as a surge. A replacement with a clear span was installed in December 2007 and brought into use in 2008, positioned to let water and debris pass beneath rather than accumulate against it; the original was demolished in April 2008. The new structure has drawn local criticism for being out of character with the conservation area, which is a fair illustration of the trade-off between heritage and conveyance in a village of this kind.
About the author. Emma is a Senior Flood Risk Consultant, and a policy and flood modelling expert. Unda has been trading since 2014, is a CIWEM Business Partner with CIWEM member and chartered (C.WEM MCIWEM) consultants, and has delivered 5,000+ flood risk assessments and drainage strategies across England and Wales.
Emma Jeffery · MSci (Hons)
Latest news



One of our experienced Flood Risk Consultants will get back to you within 60 minutes