The MAGIC Map Explained: What It Shows, and What It Doesn’t
Estimated reading time 15 minutes
The MAGIC map is Defra's free public map of environmental and countryside data for Great Britain, holding more than 400 layers from around 30 organisations in a single browser-based viewer. For anyone appraising a development site it answers one narrow question well: what is designated, protected or classified on and around this land. It holds no flood zone data at all, which is the assumption that most often sends a desk study wrong.
MAGIC carries over 400 data layers from around 30 organisations, serves around 3,500 user sessions a day and generates 4.4 million unique maps a month.
What is the MAGIC map?
MAGIC stands for Multi-Agency Geographic Information for the Countryside. Natural England runs the service under a steering group of partner organisations, and it has been live since 2002. The data covers rural, urban, coastal and marine environments across Great Britain, arranged into eight thematic groups with three basemaps and three map projections. It is free. No login, no software, any browser.
The partnership is what gives the map its reach. Natural England holds the designation and habitat data, but the Environment Agency, Historic England, the Forestry Commission, the Marine Management Organisation and Defra itself all publish through the same viewer, alongside roughly two dozen other contributors.
- Who runs it. Natural England, under direction from a steering group of MAGIC partnership organisations.
- What is on it. Over 400 data layers from around 30 organisations, in eight themes.
- Coverage. Great Britain, across rural, urban, coastal and marine environments, though the great majority of layers are England-only.
- How current it is. Datasets and the map are refreshed on a published schedule; the next update runs on 7th October 2026, with the map offline from 4pm that afternoon.
- What it costs. Nothing, and no account is needed.
One thing to check before following any older method note. Natural England moved the viewer from ArcGIS JavaScript version 3 to version 4 and decommissioned version 3 during 2025. Tools and the table of contents moved with it. Older method notes and training material now point at the wrong places. The map now lives at MagicMap.html; the old MagicMap.aspx address redirects.
Which MAGIC map layers actually change a development site?
Six families of layer do real work here. On a flood risk or drainage job they are the two groundwater layers, SSSI Impact Risk Zones, the habitat and woodland inventories, agricultural land classification, and the catchment and water quality layers. Everything else is background. Those six shape what a surface water drainage strategy for planning can propose, and what a flood risk assessment for a planning application has to address beyond the flood zone itself.
| Layer | What it tells you | What it changes |
|---|---|---|
| Aquifer Designation (bedrock and superficial drift) | Whether the ground beneath the site is a principal, secondary or unproductive aquifer | Whether infiltration drainage is likely to be viable, and how hard the acceptability argument will be |
| Groundwater Vulnerability | How exposed the underlying groundwater is to a surface pollutant | Whether a soakaway needs a treatment train ahead of it, and how much evidence the Environment Agency will expect |
| SSSI Impact Risk Zones | Whether a proposal type triggers consultation with Natural England | Whether a discharge to ground or surface water becomes a consultation matter in its own right |
| Priority Habitats Inventory and Ancient Woodland | Where protected or irreplaceable habitat sits on and around the site | Where attenuation basins, swales and outfalls can physically go |
| Agricultural Land Classification | The graded quality of the farmland, provisional or post-1988 survey | The best and most versatile land argument in site selection and the Sequential Test |
| WFD Management Catchments and water quality priority areas | The sensitivity of the receiving waterbody | How much weight the water quality case in a drainage strategy has to carry |
The two groundwater layers do the heavy work here. The aquifer designation and groundwater vulnerability layers together give a first view of whether infiltration is realistic before any ground investigation for a soakaway is commissioned, which is the single cheapest de-risking step available on a greenfield site. Read alongside the geology, they say whether a drainage strategy built on soakaways is a sound starting assumption or a wasted month, long before a BRE Digest 365 test is booked.
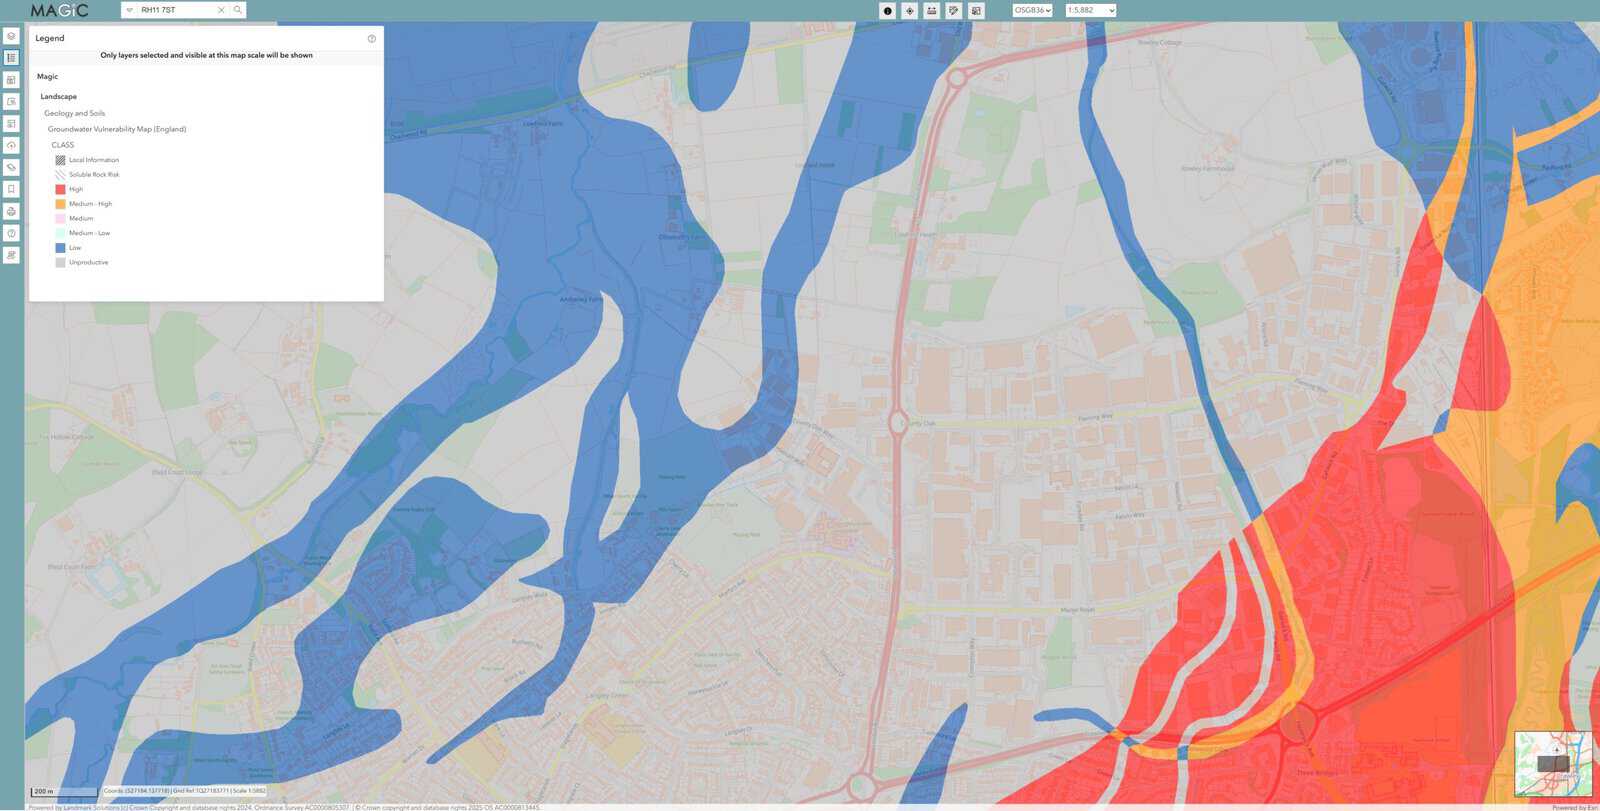
Checking the aquifer designation and groundwater vulnerability layers takes about two minutes and can save a full round of infiltration testing on a site where soakaways were never going to be accepted.
Why a soakaway can trigger a Natural England consultation
This is the layer that turns drainage design into a statutory consultation question. Natural England draws a zone around every Site of Special Scientific Interest and tags it with the proposal types that need referring. The current version is 5.4, issued on 2nd April 2025. One of those categories is why the layer belongs in the drainage chapter as much as the ecology one.
Any discharge of water or liquid waste that is discharged to ground (i.e. to seep away) or to surface water.
Natural England · SSSI Impact Risk Zone user guidance, consultation categories
That wording is very broad. A soakaway serving a farm building, an outfall to a ditch, a package treatment plant discharging to ground: every one of them sits inside it, none of them would strike a drainage engineer as an ecology matter, and all three are the kind of detail that gets settled late in a design programme rather than early. Where the site falls in a zone tagged for discharges, the local planning authority is expected to consult Natural England before determining the application. An applicant who has not anticipated that finds the consultation clock starting at the worst possible point in the programme.
The zones carry other categories that matter on development sites too: any residential net gain, non-residential development over 30 square metres outside urban areas, solar schemes above 0.5 hectares, all wind turbines, pipelines and cables, and combustion or sewage treatment plant. The guidance is explicit that the zones exclude coastal processes, do not cover marine-only sites, and do not displace any other statutory consultation duty. A discharge caught by the zone sits alongside, not instead of, any ordinary watercourse consent the outfall needs from the lead local flood authority.
The SSSI Impact Risk Zone category for discharges covers any liquid discharged to ground or to surface water, which puts a domestic soakaway inside the same trigger as a sewage treatment works.
What the MAGIC map does not show
MAGIC is a constraints map. It is not a flood risk source, a ground investigation or a contamination record, and treating it as any of those is the commonest error in a desk study built on it.
- Flood zones. MAGIC does not carry the Flood Map for Planning. Flood Zones 1, 2, 3a and 3b come from the Environment Agency's own service, and nothing on MAGIC substitutes for them.
- Surface water and reservoir risk. Held on the Environment Agency's long-term flood risk service, not here. A postcode flood risk check is the quicker route to it.
- Groundwater flood risk. No national map of the water table exists on MAGIC or anywhere else; the evidence is fragmented across British Geological Survey susceptibility data and monitored levels.
- Source protection zones. Checkable alongside MAGIC, but the definitive dataset sits with the Environment Agency, and the mapped zone is not the whole of the statutory picture.
- Ground conditions. Nothing on MAGIC replaces a percolation test, a trial pit or a borehole log, and nothing on it settles a groundwater monitoring requirement.
- Contaminated land. Not a MAGIC theme at all; that is a local authority and specialist search matter.
- Local designations. Critical drainage areas, local wildlife sites and article 4 directions are council data. A critical drainage area will not appear on MAGIC even where it governs the whole drainage approach.
The distinction shows up in the report. A flood risk assessment that cites MAGIC for its designation context and the Flood Map for Planning for its flood zone is doing it properly. One that cites MAGIC for flood risk has used the wrong source, and a case officer who knows the tool will notice.
Where the MAGIC map will mislead you
Three traps account for most of the trouble. A layer far coarser than it looks. Layers that disappear at the wrong zoom. Data nobody has resurveyed in fifty years. Agricultural land classification is the worst offender, and it is also the layer that goes straight from screenshot into planning statements.
Defra's own metadata states the Provisional Agricultural Land Classification maps are "not sufficiently accurate for use in assessment of individual fields or development sites, and should not be used other than as general guidance".
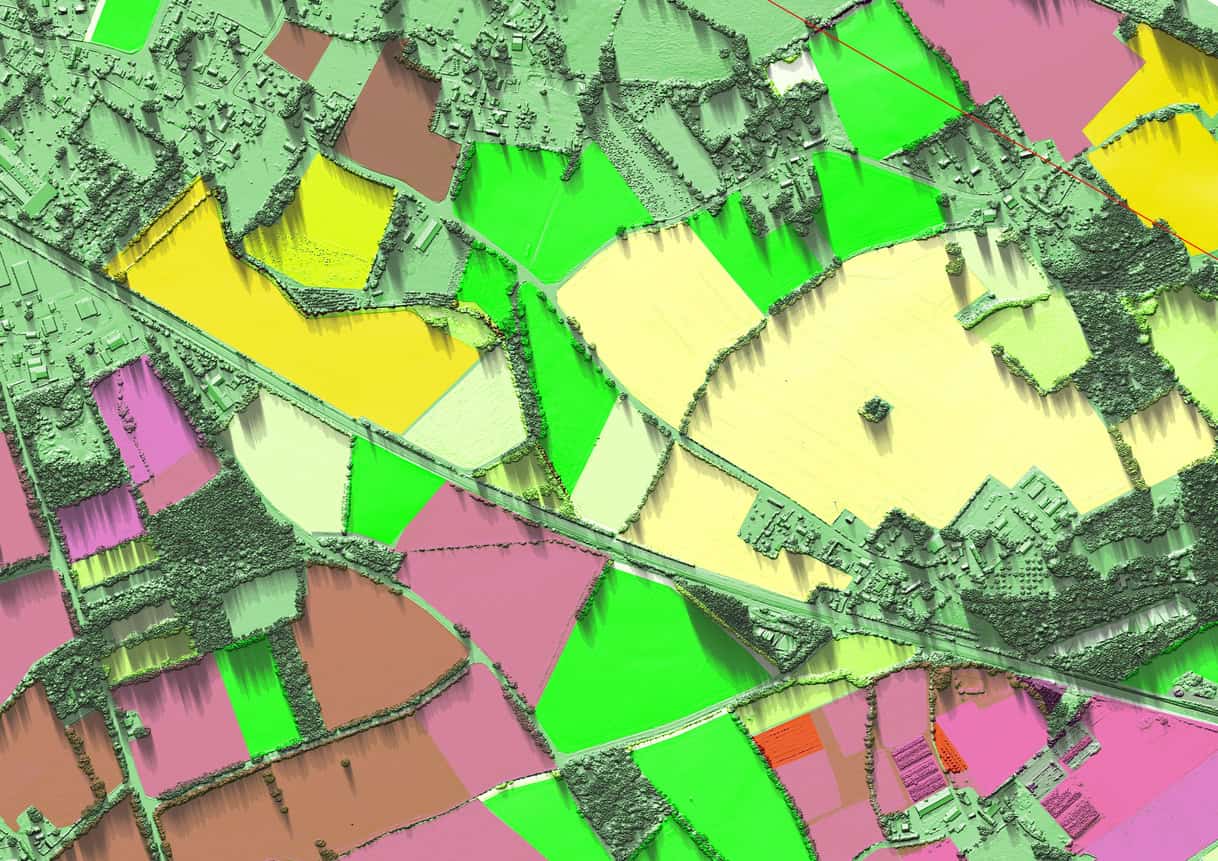
Those provisional maps were published on an Ordnance Survey base at one inch to one mile between 1967 and 1974, using a five-grade system that predates the later subdivision of Grade 3. Reading a site boundary off them is reading a line that was never drawn at that precision, on a survey that predates almost every other dataset in the same report. Where best and most versatile land is a live issue, the post-1988 detailed survey data is the layer to look for. Its absence over a given site is a finding in itself, not an answer — a point that matters more since the Land Use Framework put land quality back into the spatial planning conversation.
The second trap is quieter, and it produces false negatives rather than false precision. Many MAGIC layers have a minimum scale threshold and stay greyed out until the map is zoomed in far enough, so a layer that looks switched off may simply be waiting. Natural England publishes the thresholds layer by layer, and a clean result at a wide zoom should send you to that list before it goes in a report.
The third trap is age. MAGIC publishes its dataset update dates, but the interval between a designation changing on the ground and that change appearing in the viewer is real, and it varies layer by layer because each contributing organisation updates on its own cycle rather than the map's. Date every extract. Anything that turns on a boundary goes back to the owning organisation's dataset before it goes in a report.
What happens when a MAGIC layer flags your site?
A flag on MAGIC is rarely a refusal. Most of the time it changes what has to be evidenced, not what can be built, and the cost of finding it late falls on the programme instead of the design. What to do next depends on which layer caught the site, so work through them in the order a drainage strategy will need them.
The two groundwater layers change the hierarchy, not the scheme. A site over a principal aquifer with high vulnerability does not lose infiltration. It loses the right to assume infiltration without evidence. Bring the percolation testing forward, put treatment ahead of any soakaway, and expect the Environment Agency to want the pollution pathway set out in line with its groundwater protection position statements. Where infiltration really does fall away, the next option down the discharge hierarchy governs, and the storage volume moves with it.
An Impact Risk Zone hit changes the programme. The zone says the local planning authority is expected to consult Natural England, which makes reaching them before submission worth considerably more than reacting after validation. It also tells you what to put in front of them: the discharge point, the rate, the treatment and the receiving water, not a drainage layout on its own.
Habitat and ancient woodland move the drainage furniture, not the red line. Priority habitat or ancient woodland across part of a site rarely stops the development, but it decides where a basin, a swale or an outfall can physically sit. Picked up at masterplan stage that costs a sketch. Picked up once the layout is fixed it costs a redesign, and usually some developable area with it. The same applies to any biodiversity net gain accounting that leans on the SuDS.
Agricultural land classification sends you looking for better data. A provisional grade opens the question; it does not settle it. Where best and most versatile land bears on the case, the post-1988 detailed survey is the layer to look for, and where no detailed survey covers the site a field survey is the only thing that will settle it.
- Confirm the flag against the owning organisation's own dataset. The viewer is a publishing route, not the register. Natural England's Open Data Geoportal carries the source layers for use in QGIS or ArcGIS Pro.
- Find the category that caught the site. An Impact Risk Zone can be tagged for a dozen proposal types and only one of them may apply.
- Decide whether it changes the design or only the evidence. Most flags change the evidence, and that distinction sets the budget.
- Test the flag against the layout while the layout can still move, using the 2025 National Standards as the yardstick for what the drainage has to achieve.
- Raise it with the consultee before submission rather than after validation.
All of that is cheaper at appraisal than at determination, which is the argument for running the check before a site is bought, not after a layout is drawn. A flood risk feasibility study exists to answer exactly this set of questions early, and the mapping work behind it is ordinary GIS rather than anything exotic.
Nothing on MAGIC refuses a planning application. What a late flag costs is programme: a consultation that could have run alongside the design instead runs after it.
Does MAGIC cover Wales and Scotland?
Partially. Not usefully, for most planning work. MAGIC describes its coverage as Great Britain, and a handful of marine and GB-wide layers do extend beyond England, but the great majority of the designation, habitat and land classification layers stop at the border.
For a Welsh site, DataMapWales and Natural Resources Wales publish the equivalent designation and habitat layers, and a flood consequence assessment under TAN15 draws on the NRW flood map instead of anything on MAGIC. For a Scottish site, NatureScot's SiteLink is the protected-sites register. Checking a Welsh or Scottish site on MAGIC alone will return a misleadingly empty result.
Common questions about the MAGIC map
What does MAGIC stand for?
Multi-Agency Geographic Information for the Countryside. The name dates from the service's launch in 2002, when it was built as a shared publishing route for countryside data held by several government bodies. It has outlasted its own scope: the map now covers urban, coastal and marine data too.
Is the MAGIC map free to use commercially?
The map is free to view and the data is free to download, but reproducing a map image is a separate question. MAGIC's terms require a current Ordnance Survey licence for any reproduction beyond immediate personal reference, because the basemap is Ordnance Survey material. Taking the underlying dataset instead of the image avoids the issue.
How often is MAGIC updated?
Natural England publishes scheduled dataset update dates, with the interactive map taken offline for a few hours while each update runs. Individual layers move at the pace of the organisation that owns them, so an update to the viewer does not mean every layer has been refreshed.
Can MAGIC be used to check whether a site needs a flood risk assessment?
No. Whether a flood risk assessment is required turns on the flood zone, the site area and the sources of flooding affecting the land, none of which MAGIC holds. It is useful alongside that check, for the designations and receptors a drainage strategy will have to address.
Does a clear MAGIC result mean a site has no environmental constraints?
No. MAGIC shows mapped designations, and several real constraints are unmapped: source protection zones default around unmapped private water supplies, priority habitat inventories are not exhaustive, and a protected species can be present on land carrying no designation at all. A clear result narrows the question; it does not close it.
A MAGIC check takes twenty minutes. It decides how much of the rest of the desk study is guesswork. Unda reads these layers on every site it appraises, and the findings go straight into the drainage strategy or flood risk assessment that follows. To have a site checked properly, talk to Unda about a flood risk assessment for planning or a surface water drainage strategy.
About the author. Kacper is a Flood Risk and Drainage Consultant and Unda's in-house GIS and automation specialist, working in QGIS, ArcGIS Pro, Python and R. Unda has been trading since 2014, is a CIWEM Business Partner with CIWEM member and chartered (C.WEM MCIWEM) consultants, and has delivered 5,000+ flood risk assessments and drainage strategies across England and Wales.
Kacper Buksa · MSc, BSc (Hons)



One of our experienced Flood Risk Consultants will get back to you within 60 minutes
