Shrewsbury Floods, Ironbridge and Bewdley: What 25 Years of Severn Defences Changed

Estimated reading time 18 minutes
Shrewsbury floods because the town sits inside a loop of the River Severn, on ground the river has always used, at the foot of a catchment that gathers rain across mid Wales. Ironbridge and Bewdley flood for the same reason a few miles downstream. None of that has changed since the autumn of 2000. None of it is going to.
What has changed is everything built around it. Twenty-five years after the floods that put Frankwell under water three times in six weeks, the Severn towns have walls, demountable barriers, telemetry and a warning system that usually gives them most of a day’s notice. They still flood. What is different is who gets wet, how often, and how much of it anyone now has to improvise on the night.
The River Severn reached 5.25 metres at Welsh Bridge in Shrewsbury on 1 November 2000. It is still the highest level in the Environment Agency’s record at that gauge.
Why the Severn floods its towns so often
The Severn floods its towns because it collects a great deal of water quickly and then lets it go slowly. Rain falling on the Cambrian Mountains reaches the upper river within hours. The wide, flat floodplain through Shropshire and Worcestershire then takes days to pass the peak. Shrewsbury, Ironbridge and Bewdley all sit on that slow reach, in historic cores built hard against the water because the water was the reason the towns were there.
The mechanism belongs to the river rather than the towns, and we set it out at length on our guide to River Severn flooding and flood risk. Three parts of it matter here.
- A Welsh head and English towns. The catchment drains roughly 11,000 square kilometres between Plynlimon and the estuary, and most of the rain that floods Shropshire falls in Wales a day or two earlier.
- A long, slow body. Once out of bank a Severn flood sits on the land. That is why these towns close roads for days rather than hours, and why the warning window is unusually generous by English standards.
- Towns built on the water’s ground. Frankwell, the Wharfage and Beales Corner are all functional floodplain in everything but name. They were not sited badly; they were sited several centuries before a floodplain was a planning concept.
That last point carries straight into modern practice. A site on this river is judged on the catchment’s behaviour rather than the plot’s, and understanding the difference between a main river and an ordinary watercourse is where that assessment starts. It is the reasoning behind every credible flood risk assessment for planning prepared for a riverside development in England.
How high does the River Severn have to rise before these towns flood?
Property flooding becomes possible at 2.90 metres at Shrewsbury’s Welsh Bridge gauge, 4.80 metres at Buildwas above Ironbridge, and 4.00 metres at Bewdley. Those are the Environment Agency’s own published thresholds at each station, and they are the most useful single fact about Severn flooding that almost nobody watching a live river level ever sees.
They matter because of how little separates them from an ordinary winter. Welsh Bridge runs between 0.42 and 2.70 metres for most of the year, and property flooding starts twenty centimetres above the top of that range. Twenty centimetres. The record set in 2000 is another 2.35 metres higher again, and the entire working life of a riverside town in Shropshire happens inside a band narrow enough to be crossed by a wet fortnight in Wales.
Each gauge then publishes a ladder of local thresholds above that point, naming the roads and the streets that go under at each step. You can check the current reading at Welsh Bridge, Buildwas and Bewdley on the Environment Agency’s service, or across England on Unda’s live river levels map. To screen a specific address rather than a gauge, use the flood risk map by postcode.
Autumn 2000, and what it exposed
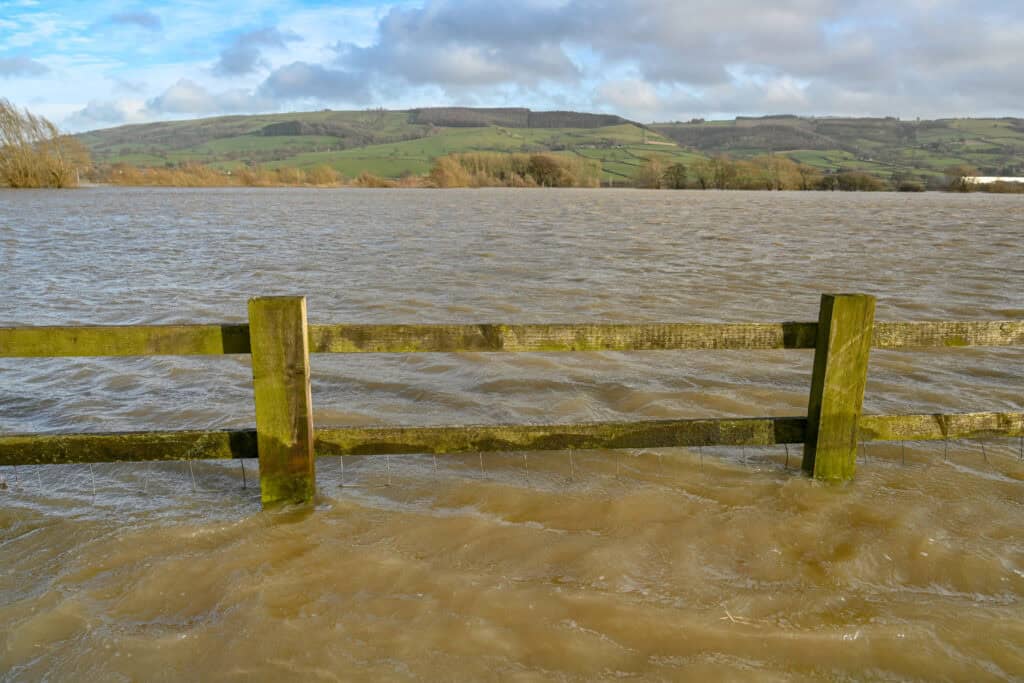
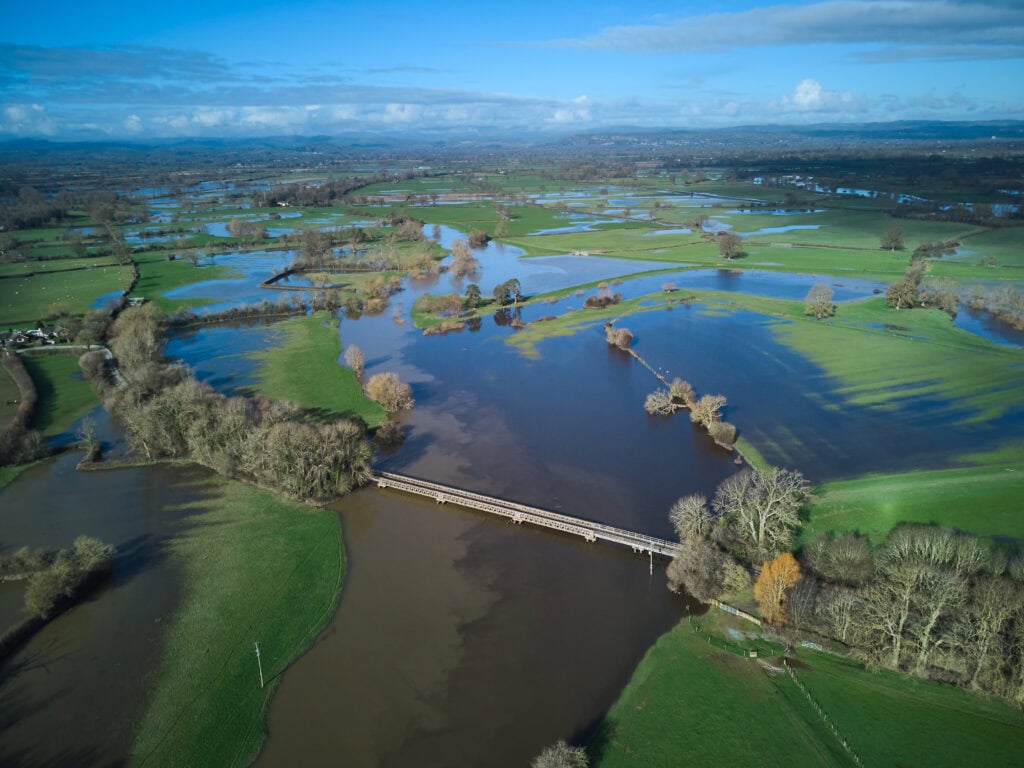
The autumn of 2000 was the wettest in the England and Wales rainfall series, which runs back to 1766. Around 489 millimetres of rain fell between September and November. By late October every catchment feeding the Severn was saturated, and the river came up three times in six weeks.
Shrewsbury took the worst of it. Frankwell flooded repeatedly, and on 1 November the Welsh Bridge gauge reached 5.25 metres. Bewdley recorded 5.56 metres the following day, still the highest level ever measured there. Buildwas, above Ironbridge, reached 7.04 metres.
What the flood exposed was not the river. It was the arrangement around it. There was no coordinated national flood forecasting service, responsibility was split between bodies with no clear hierarchy, and defences existed in some towns and not others for reasons that had more to do with historic funding boundaries than with risk. The Environment Agency’s own review of the autumn said as much.
Two things followed. Nationally, the reforms that produced the Flood Forecasting Centre, the Pitt Review after the 2007 floods and eventually the Flood and Water Management Act 2010 (the Act itself) reorganised who was responsible for what, and gave the county councils their role as Lead Local Flood Authority. Locally, each Severn town got a scheme. Different timetables, different designs, very different results. The same autumn is examined from three other catchments in our companion pieces on York and the River Ouse, Lewes in East Sussex and the flooded runways at Crawley and Gatwick.
Shrewsbury: Frankwell, and defences that go up before the water arrives
Shrewsbury’s answer to 2000 was the Frankwell Flood Alleviation Scheme, completed in November 2003 at a cost of about £3.5 million to the Environment Agency. It protects 74 properties to a 1-in-100-year standard. It uses demountable barriers in aluminium, 1.5 metres high along the promenade and 3 metres across the car park entrance, set on reinforced concrete walls and underground steel sheet piling.
Shrewsbury flooding now follows a fairly predictable script, and the scheme works because of the warning window. The Environment Agency can usually give the town six to twelve hours’ notice, which is long enough to raise the barriers in a planned sequence instead of a scramble. Storm Claudia in November 2025 was the routine version: Shropshire Council closed the Frankwell car parks on the Friday evening, the barriers went up on the Saturday morning across the River Severn at Frankwell flood warning area, and the town was working again on the Monday.
| Level at Welsh Bridge | What happens | Context |
|---|---|---|
| 0.42–2.70 m | Normal range | The river as the town sees it most of the year |
| 2.70 m | Low-lying land floods | Top of normal range; flood alerts may be issued |
| 2.90 m | Property flooding becomes possible | The threshold the Environment Agency works to |
| 3.20 m | Roads from Atcham to Cross Houses | Road closures begin outside the town |
| 3.60 m | St Julians Friars car park | Riverside parking closes |
| 3.90 m | B5067 Berwick Road | Routes into Shrewsbury affected |
| 4.50 m | Coleham Head road crossing | Crossing of the river restricted |
| 4.70 m | B4380, old A5 lane onto the bridge | Above anything seen since February 2020 |
| 5.25 m | Highest level ever recorded | 1 November 2000 |
The table makes a point no paragraph does. A town that closes roads at 3.20 metres and can flood property from 2.90 metres is not waiting for a once-in-a-lifetime event; it is managing something that happens most winters. Anyone developing there works to exactly these numbers, which is what a flood risk assessment in Shrewsbury sets against a specific site and its finished floor levels.
In March 2026 a further £1 million was secured for Frankwell and for the Minsterley Flood Alleviation Scheme, drawn from an £830 million national settlement and routed through a nature-based upstream demonstrator programme under the River Severn Partnership’s Severn Valley Water Management Scheme. The intention is to slow the flow before it reaches the town rather than stop it at the town’s edge. It is the same thinking behind natural flood management everywhere else in the country.
Ironbridge: the barriers that moved
Ironbridge flooding is the hardest of the three problems to solve. The Gorge is steep, narrow and a World Heritage Site, which rules out most of what worked at Frankwell. The town’s defence is a line of demountable barriers along the Wharfage, raised on readings from the Buildwas gauge upstream. That is the whole scheme.
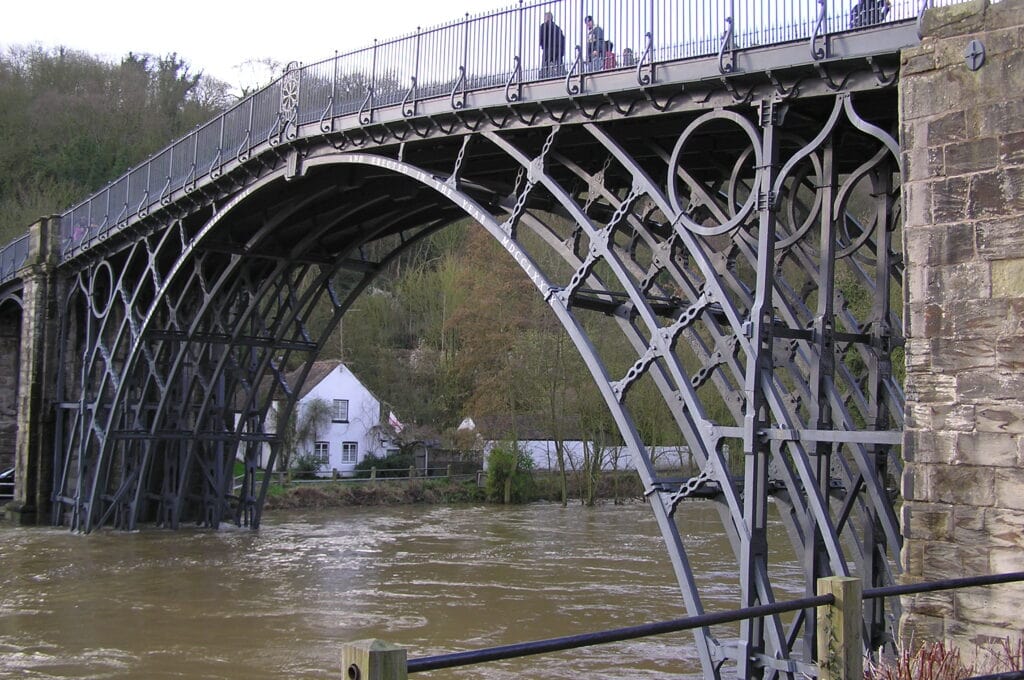
Flooding in Ironbridge is therefore forecast from a gauge two miles away, because the Gorge itself is no place to measure a river. The Iron Bridge has stood over that reach since 1779 and has watched every one of these floods pass under it, which is a useful corrective to the idea that any of this is new.
February 2020: what Storm Dennis showed
During Storm Dennis the river reached levels not seen since 2000. Sections of barrier were pushed back where the road surface could not hold them, seepage came through the joints, and the Wharfage was evacuated. The line largely held, but the event showed plainly that a demountable defence is only as good as the ground it is anchored to.
The Environment Agency and Telford & Wrekin Council answered the anchoring and surfacing problems directly, and the town has been moving from temporary defence towards permanent ever since.
The 2020 event at Ironbridge is the one I still use to explain residual risk to clients. The barriers did not fail in any dramatic sense, and most of the line held. But a defence that depends on friction against a road surface has a failure mode you can describe, model and plan for, and that is a very different conversation from treating the town as protected.
Emma Jeffery · Senior Flood Risk Consultant, Unda
In April 2025 more than £708,000 was allocated to properties in Ironbridge that the barrier line does not reach, with 31 properties surveyed for resilience measures and permanent flood walls designed for Bower’s Yard, Ladywood and Dale End. The gauge thresholds those decisions are built on are steeper than Shrewsbury’s, because the Gorge holds a great deal more water in a much narrower channel.
- 3.40 metres. Top of the normal range at Buildwas; low-lying land flooding becomes possible above this level.
- 4.80 metres. Property flooding becomes possible. This is the threshold the Environment Agency works to for the Gorge.
- 6.60 metres. Buildwas Road and properties in Ironbridge itself begin to flood.
- 6.80 metres. The B4373 near Jackfield Bridge goes under, cutting the route along the south bank.
- 7.04 metres. The highest level on record, reached on 2 November 2000; the highest gauged flow, 664 cubic metres a second, came later, during Storm Franklin in February 2022.
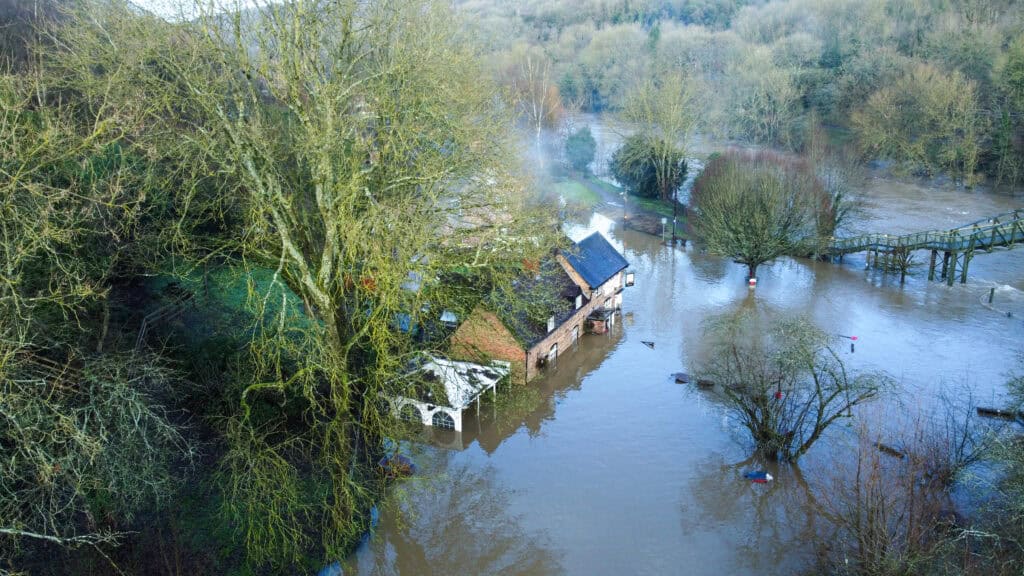
Ironbridge illustrates a rule that applies to every defended site in England: the Flood Map for Planning is drawn as though the defences were not there. A property behind the Wharfage barriers still sits in Flood Zone 3, which is why a flood risk assessment in Ironbridge has to deal with the residual flood risk rather than the protected condition.
Bewdley: from two thousand loose parts to a permanent wall
Bewdley shows what a quarter-century of iteration looks like when it finally finishes, which is to say slowly, expensively, and only after the temporary answer has been pushed past the point where anyone can defend keeping it. The town gained demountable barriers along Severnside in 2006, protecting around 300 homes and businesses. They have been deployed 29 times since, which is a fair measure of how routine flooding is here.
The other bank was the problem. Beales Corner was held by a temporary system assembled from roughly 2,000 individual parts and taking up to twelve hours to put together, at a point on the river where twelve hours is sometimes all the notice there is.
- 2006. Severnside gains demountable barriers, protecting around 300 homes and businesses on the town side of the river.
- 2020 and 2022. Storms Dennis and Franklin push the temporary Beales Corner system to its limit, and the case for something permanent stops being arguable.
- 2023. Construction begins on a permanent scheme, at the cost of two years of disruption to a small riverside town.
- September 2025. A 300-metre defence line of walls, gates and rapid-deployment barriers opens, running from Pleasant Harbour House to Millside Court and protecting around 50 properties.
The £10 million Beales Corner scheme replaced a temporary defence of roughly 2,000 individual parts that took up to twelve hours to assemble.
Ten million pounds for fifty properties is two hundred thousand pounds each. That arithmetic is why schemes like this take twenty-five years to arrive. It is also why several towns downstream are still waiting, and why defences below their design standard remain such a common finding nationally. If you are buying or developing in the town, a flood risk assessment in Bewdley is the document that establishes what the new defence does, and does not do, for one particular address.
What 25 years has changed, and what it has not
The 2000 floods bought the valley twenty-five years of investment, and it is worth being precise about what that investment did. What has changed is the response. Warnings arrive earlier. Barriers go up on a published schedule, roads close on stated thresholds, and community flood groups often act before the alert has finished being issued. The Severn towns are measurably better at flooding than they were in 2000, and the reforms that followed that autumn are the reason. Downstream, Worcester, Upton-upon-Severn and the Tewkesbury flood defences have each moved on their own timetable, which is why the level of protection changes markedly from one town to the next along a single river.
What has not changed is the river, the ground the towns are built on, or the flood zones. All three towns still sit largely in Flood Zones 2 and 3 on the Flood Map for Planning, because that map ignores defences by design. The August 2026 NPPF reorganised the policy around them without softening any of it, and the climate change allowances a scheme has to apply over a hundred-year lifetime are unchanged.
The honest position after twenty-five years is that the Severn towns have got very good at flooding, not at not flooding. A demountable barrier is a promise that somebody will be there to raise it. A permanent wall is a promise that the design flood was estimated correctly. Both are good promises. Neither is unconditional, and an assessment that treats either as the end of the conversation has not done its job.
Emma Jeffery · Senior Flood Risk Consultant, Unda
That is the standing argument for property flood resilience alongside the engineered schemes rather than instead of them, and it is why the direction of travel has turned upstream. The Severn Valley Water Management Scheme aims to reduce risk to around 3,000 homes and businesses by holding water back across the catchment rather than defending each town in turn. It is a longer and far less visible programme than a wall. On a river this size it is the only approach that scales.
What the Severn towns teach anyone building near a river
Three lessons from this valley transfer to any riverside site in England.
Read the catchment, not the site boundary. The flood that reaches Bewdley was made in Wales two days earlier, and nothing about the plot itself would have predicted it. The catchment is the unit of analysis, which is why a competent assessment starts a long way upstream of the red line.
Defended is not the same as safe. Every defence has a design standard and a failure mode, and it is the failure mode an assessment has to plan for. Finished floor levels, safe access and escape and resilient construction all exist for the day the barrier is overtopped, not the years it holds.
Design for the water you cannot send to the river. When the Severn is high, nothing drains into it, and that is precisely when a site’s own surface water drainage strategy — storage, controlled discharge and a routed exceedance path — decides whether the development floods. Surface water does not appear on the flood zone map at all.
If you are planning a development anywhere on the Severn, in Shrewsbury, Ironbridge, Bewdley or further down the valley, Unda prepares flood risk assessments and drainage strategies for planning, property purchase, insurance and BREEAM, across Shropshire and Worcestershire. Call 01293 214444 or start a quote online for a fixed fee within the hour.
Severn flooding: frequently asked questions
Which Severn town floods most often?
Bewdley, on the evidence of how often its defences are needed: the Severnside barriers have been deployed 29 times since 2006. Frequency is not the same as severity, though. Ironbridge floods less often but more dangerously, because the Gorge concentrates depth and velocity that the wider reaches do not.
How much warning does Shrewsbury get before the Severn peaks?
Usually six to twelve hours, and the Frankwell scheme was designed around exactly that window. The lag exists because the water has to travel from the Welsh headwaters, which is also why the Severn often peaks in bright weather a day or two after the rain has stopped.
Does a new flood defence change a property’s flood zone?
No. The Flood Map for Planning is drawn undefended, so a property directly behind the new Beales Corner wall sits in the same flood zone it did before the wall was built. The map shows where water would go, not what stands in its way, and separating the two is a site-specific exercise rather than something you can read off a screen.
Can you still get a mortgage or insurance on a Severn riverside property?
Usually, but the terms turn on evidence rather than on the flood zone alone. Most homes built before 1 January 2009 remain eligible for Flood Re, the government-backed reinsurance scheme. An independent flood risk survey for a property purchase, or a flood risk assessment for insurance, establishes the actual finished floor levels, defence standards and property-level resilience, and that evidence is what tends to move a premium or an excess.
Does upstream natural flood management actually count in an assessment?
Not as site mitigation. Catchment measures do not appear in Environment Agency hydraulic models, and no Lead Local Flood Authority will credit an upstream scheme against a specific site’s requirements. Their value is strategic and cumulative, which is a real benefit to a town and no help at all to a planning application.
Does Shrewsbury flood every winter?
Something in the town floods in most wet winters, though rarely the same thing twice. Low-lying land and riverside car parks go under at levels the Severn reaches routinely, while the Frankwell barriers are deployed only when the forecast crosses the property-flooding threshold. The distinction between a town that gets wet and a town that floods is exactly what the gauge thresholds are for.
About the author. Emma is a Senior Flood Risk Consultant, and a policy and flood modelling expert. Unda has been trading since 2014, is a CIWEM Business Partner with CIWEM member and chartered (C.WEM MCIWEM) consultants, and has delivered 5,000+ flood risk assessments and drainage strategies across England and Wales.
Emma Jeffery · MSci (Hons)
Latest news



One of our experienced Flood Risk Consultants will get back to you within 60 minutes
