York Flooding: Why the Ouse Rises, and What 25 Years of Defences Changed

Estimated reading time 18 minutes
York flooding is not a freak event. It is the predictable consequence of where the city was built: at the meeting point of two rivers, at the bottom of a catchment draining most of the Yorkshire Dales, on ground flat enough that water spreads rather than passes through. Rain falling on the fells above Wensleydale on a Monday can be standing in a cellar on King’s Staith by Thursday.
In November 2000 that arrangement produced the highest river level ever recorded in the city, and the images of a submerged riverside became the defining picture of an extraordinary autumn. Twenty-five years and £83 million of defences later, York is far better protected than it was. It is not, and cannot be, protected absolutely. That distinction is the whole subject of this article.
The River Ouse reached 5.40 metres at York’s Viking Recorder gauge on 4 November 2000. It remains the highest level in a record the Environment Agency still maintains at that station today.
Why does York flood?
York floods because three upland rivers arrive at once. The Swale, the Ure and the Nidd all rise in the Yorkshire Dales and combine into the Ouse upstream of the city, which then crosses a floodplain flat enough to hold water rather than shed it. A second river, the Foss, joins inside the city walls and cannot discharge while the Ouse is high.
Rainfall gathered from thousands of square kilometres of Pennine and Dales upland therefore converges on a single narrow urban reach, one where medieval quaysides, a Victorian sewer network and a modern working city all sit within a few metres of the same water level.
Four things compound each other. None of them would be enough on its own.
- A converging catchment. The Swale, Ure and Nidd meet within a few miles of each other above York. When a weather system sits over the Dales long enough to soak all three, their flood peaks coincide instead of passing one after another. The Environment Agency’s catchment data sets out how the system drains.
- A slow, flat valley. The Vale of York offers almost no gradient. Water arriving from the Dales does not rush through; it backs up and spreads, which is why a York flood lasts days rather than hours and why so much of the surrounding land works as functional floodplain.
- A tributary with nowhere to go. The Foss is a small river joining a much larger one. When the Ouse is in flood, the Foss cannot discharge into it and instead backs up through Huntington Road, Foss Islands and Peasholme Green.
- A city built to shed water fast. York’s medieval core is paved, tight and short of green space, and parts of the drainage beneath it are Victorian or older. The clay soils of the surrounding farmland stop infiltrating once saturated and pass rainfall straight to the rivers.
The lag is the part people find counter-intuitive. Because the water has to travel from the Dales, York’s peak can arrive a day or more after the rain has stopped locally, often on a clear, bright morning. Understanding how a whole catchment behaves, rather than only what fell inside the red line, is the reasoning behind every credible flood risk assessment for planning prepared for a riverside development in England.

How high does the River Ouse have to rise before York floods?
Property flooding in York becomes possible once the Ouse passes 3.00 metres at the Viking Recorder gauge near Lendal Bridge. The city centre begins to flood at about 4.17 metres, Skeldergate and River Street at 4.57 metres, and Clifton at 5.10 metres. The all-time record is 5.40 metres. The gauge’s normal range is 0.05 to 1.90 metres, so the difference between an ordinary day and a serious flood is a matter of a few metres of river level.
Those thresholds are published by the Environment Agency at the gauge itself, and they are the most useful single piece of information about York flooding that almost nobody looking at a live river level ever sees, because the number on the screen means nothing without the scale it belongs to.
| Level at Viking Recorder | What happens | Context |
|---|---|---|
| 0.05–1.90 m | Normal range | The river as most visitors see it |
| 2.20 m | Low-lying land floods | Flood alerts may be issued |
| 3.00 m | Property flooding becomes possible | The threshold the Environment Agency works to |
| 3.40 m | St George’s Field | Riverside car park closes |
| 3.57 m | King’s Staith walkway under water | Reached during Storm Claudia, November 2025 |
| 4.00 m | Acaster Lane | Road closures begin outside the centre |
| 4.17 m | York city centre | Central streets start to flood |
| 4.47 m | A19 at Fulford | Main route into the city affected |
| 4.57 m | River Street and Skeldergate | Riverside properties at risk |
| 5.10 m | Clifton | Residential flooding north of the centre |
| 5.40 m | Highest level ever recorded | 4 November 2000 |
| 5.50 m | Marygate and North Street | Above anything yet recorded at the gauge |
The table makes a point no paragraph does: how little of that range is comfortable. Barely a metre separates a river at the top of its normal range from one closing roads, and only another metre and a half separates that from the worst flood in four centuries. York does not flood only in a once-in-a-lifetime event. It floods, somewhere, most winters.
In November 2025 Storm Claudia put water across the walkway at King’s Staith with the Ouse at just 3.57 metres, barely two thirds of the 2000 peak and a level the river reaches in an ordinary wet winter.
You can check the current reading at the same gauge on the Environment Agency’s check for flooding service, or across England on Unda’s live river levels map. City of York Council also publishes local flood advice and road closure information.
The November 2000 flood: York’s highest river level on record
The autumn of 2000 was the wettest in the England and Wales rainfall series, which runs back to 1766. Between September and November, 489 mm of rain fell across England and Wales. October alone delivered 188 mm, the wettest October since 1903, and Linton-on-Ouse in North Yorkshire recorded 134.6 mm that month, breaking its own record. By the time the Ouse peaked on 4 November, every catchment feeding York was already saturated. There was nowhere left for the water to go.
The River Ouse at York on 4 November was 5.3 m above its normal summer level, the worst in 400 years of records, with some 5,000 properties affected.
Met Office · The wet autumn of 2000
Through late October the water crept up the quayside steps a few centimetres at a time. By the first week of November, King’s Staith, Lower Bootham and Clementhorpe were under water, power had been lost across parts of the city, hundreds of people had been evacuated from riverside homes and businesses, and emergency pumps were running around the clock in a fight that would last weeks rather than days. York Civic Trust’s record of the event puts 540 properties flooded in the city, with a further 320 at serious risk.
Onlookers gathered at Lendal Bridge to watch the river rise. Some cut new marks beside the high-water plaques from 1947 and 1625. York has kept that habit for four centuries, which is why the flooding history of York is better documented than that of almost anywhere else in England.
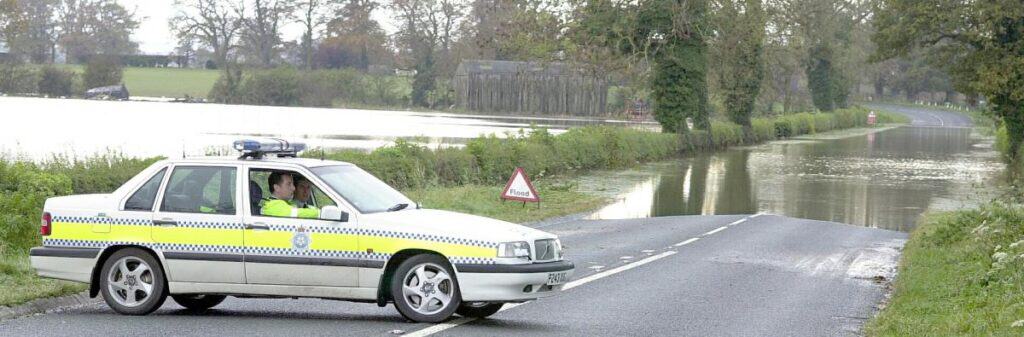
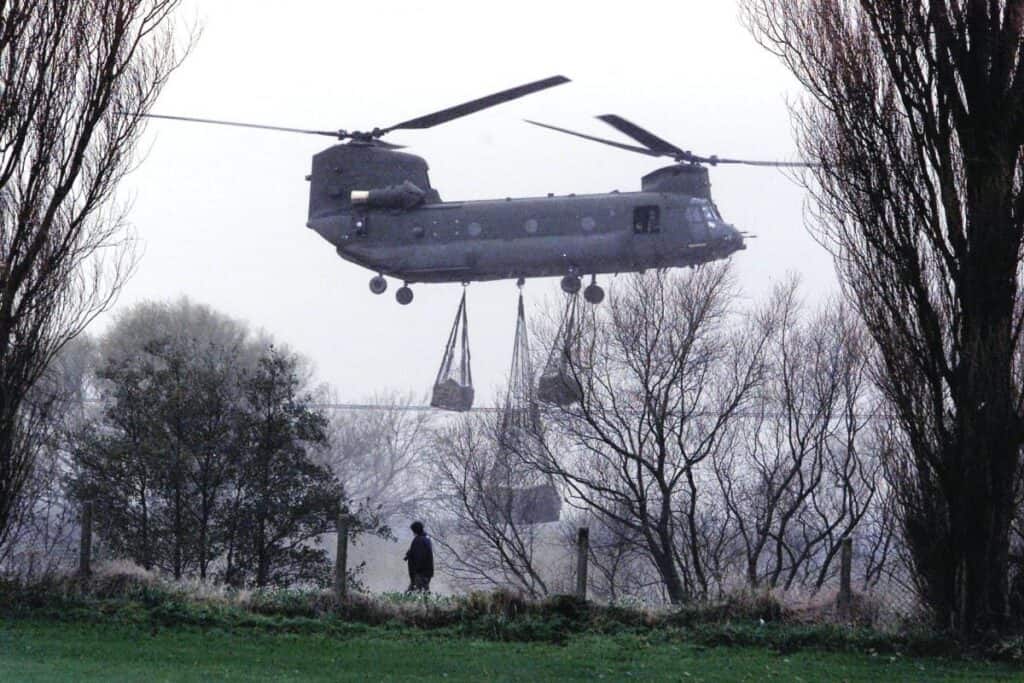
The Foss Barrier, built in 1987 to stop the Ouse backing up the smaller river, held. Its 16.5-tonne gate stayed down for weeks and its pumps ran continuously. It was the first real demonstration of how much of York’s city centre depended on a single piece of machinery. That point would be made far more forcefully fifteen years later.
What the 2000 floods changed nationally
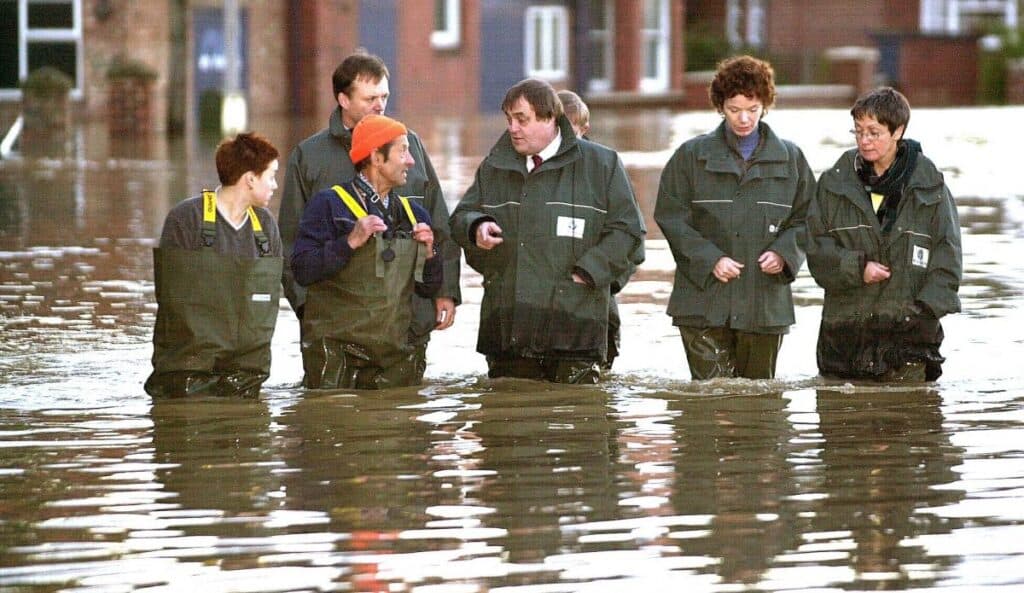
York became the defining image of the autumn 2000 floods, and the Environment Agency’s subsequent review made it a case study in what had gone wrong: uneven warning coverage, patchy defences, and poor coordination between the bodies responsible. Streets on one side of a road were protected by a floodwall while streets a few metres away had nothing, which meant the scheme’s effectiveness depended less on its engineering than on which side of an old funding boundary a property happened to sit.
From flood defence to flood risk management
What followed was a change of philosophy rather than a change of engineering. The country moved from flood defence, meaning higher walls, to flood risk management, which accepts that some flooding will happen and concentrates on reducing the harm it does through planning control, catchment-scale coordination and community readiness.
That thinking ran through the 2007 floods and the Pitt Review that followed them, and was eventually written into the Flood and Water Management Act 2010.
The 2010 Act created the Lead Local Flood Authority role, gave Internal Drainage Boards a clearer place in planning, and sat alongside national forecasting through the Flood Forecasting Centre and the Met Office, with the Environment Agency as the consultee on main river risk.
The practical legacy of 2000 is that a developer today has to prove a site will stay safe for its whole design life, which is a far harder test than showing it sits behind a wall.
York was not alone. The same storm season put Lewes in East Sussex under water, closed the runways at Gatwick, and began the long cycle of repeat flooding along the River Severn. Unda has looked at each of them in this series, and the pattern is consistent: the places that recovered best were the ones that treated 2000 as a design brief rather than a disaster.
Boxing Day 2015: when the Foss Barrier was overwhelmed
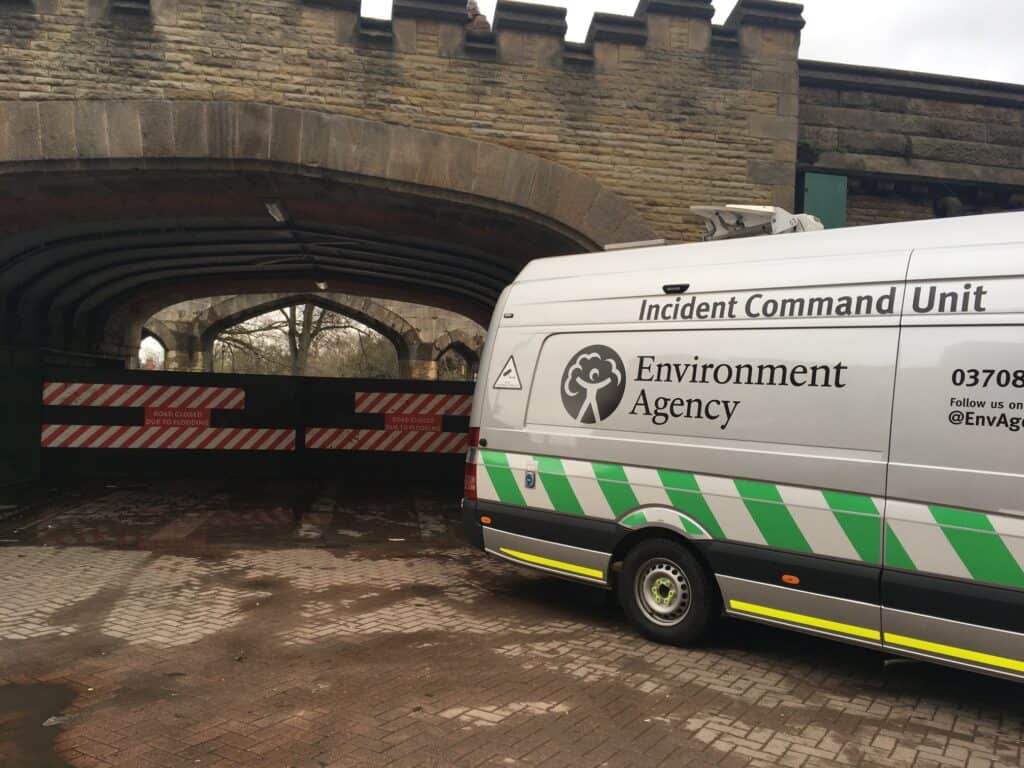
On 26 December 2015 the Ouse peaked at around 5.2 metres. That is lower than in 2000, and more properties flooded. City of York Council records 627 properties flooded in York that December. The reason was not the height of the river but the failure of the thing protecting the Foss.
Storm Eva arrived three weeks after Storm Desmond, on ground that had not drained. Water then rose inside the Foss Barrier’s own pumping station and threatened the electrical supply to all eight pumps at once, which forced the Environment Agency to choose between a controlled flood that night and the permanent loss of the machinery that protects the Foss. It raised the gate.
- Storm Eva stalls over the Pennines. Three weeks after Storm Desmond, rain falls on saturated ground across the Ouse catchment.
- The pumping station floods. Water reaches the Foss Barrier’s own electrical plant, putting all eight pumps at risk of being lost at once.
- The gate is raised at 18:45 on 26 December. The Environment Agency lifts the barrier to save the pumping station, accepting that the Ouse will back up the Foss.
- The Foss floods from behind. Huntington Road, Foss Islands and Peasholme Green go under, the areas the barrier exists specifically to protect.
- The pumps return. Four restart on 29 December and the remaining four on 30 December.
That decision is worth sitting with, because it is the clearest illustration in England of something an assessment has to consider on every defended site. A flood defence does not remove risk; it holds it back to a design standard and concentrates what remains into the moment the defence stops working. Leeds learned the same lesson on the same night, thirty miles away, when the River Aire rose more than a metre above its previous record and put around a thousand homes and four hundred businesses under water in a city that had also believed itself defended.
What £83 million has built since
York’s response has been the largest flood scheme of its kind in the north of England, and it is now substantially complete. The work splits into three parts: rebuilding the Foss Barrier, raising and extending defences along the Ouse, and holding water back upstream before it reaches the city at all.
- £38 million on the Foss Barrier. Eight replacement pumps lifted capacity from 30 to 50 cubic metres per second, with the electrical plant moved above flood level. Completed April 2022.
- £45 million on river defences. Scarborough Bridge to Ouse Bridge, Clementhorpe, Bishopthorpe, Coppins Farm and Clifton and Rawcliffe, delivered in phases from 2022 under the York Flood Alleviation Scheme.
- More than 2,200 properties better protected, with a further 740 as the remaining phases complete, according to the City of York five-year flood plan.
- Upstream storage. The Clifton and Rawcliffe Ings and the Poppleton washlands are deliberately allowed to flood, taking the top off the peak before it reaches the city.
- Catchment-scale work. Ousewem is applying natural flood management across the Swale, Ure, Nidd and Upper Ouse, with 2026 its largest year of delivery so far.
The engineering had a constraint most schemes do not: it had to fit inside a conservation area of listed buildings, medieval walls and riverside pubs that people travel to look at. Transparent glass panels now guard the riverside without blocking the view, demountable gates close in winter and disappear again in summer, and embankments are shaped as landscaped public space rather than as visible engineering. Every one of those choices costs more to build and more to maintain than a concrete wall would.
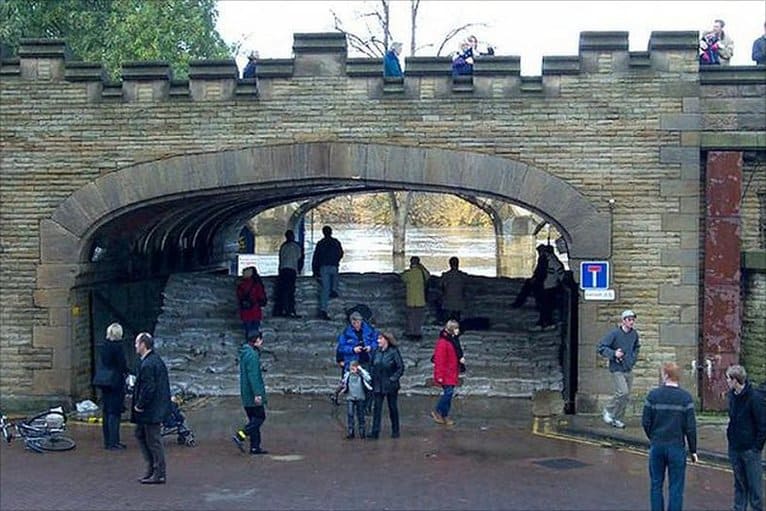
The interesting thing about York is that the engineering had to fit inside a conservation area, so nothing could be solved simply by building higher. Glass panels, demountable gates and landscaped embankments all cost more to build and more to maintain than a concrete wall. The city took that trade deliberately, and it is the reason the defences exist at all, because a wall York would not accept is a wall York would never have built.
Jackie Stone · Director, Unda
Alongside the hard engineering has come the quieter work: flood doors, raised electrics, property-level resilience measures and community emergency plans. York’s residents, caught unprepared in 2000, are now among the most flood-aware in the country.
Is York safe from flooding now?
No, and no scheme of this kind claims otherwise. York’s defences are built to a standard of protection, which means they cut how often flooding happens to an agreed level and do nothing above it. The Environment Agency’s Flood Map for Planning still shows much of riverside York in Flood Zone 3, because those maps are drawn ignoring defences on purpose. They describe where water would go if nothing stood in its way.
That is not a technicality. It is why a site sitting immediately behind a new floodwall still needs its residual flood risk assessed from first principles, and why “we’re defended now” is not an answer that survives contact with a planning officer or the Environment Agency’s consultation response. Unda has written separately on why a site stays in a flood zone after defences are built and on what happens when defences fall below their design standard.
Insurer modelling reported by Unda puts York’s surface water flood risk up around 30 per cent by 2050, with peak rainfall intensity rising by as much as 15 per cent. That pressure falls on the drainage beneath the city, not on the river defences beside it.
The next twenty-five years will test a different mechanism from the last. The Ouse is now managed; the rain falling directly on York’s streets is not, and surface water flooding does not appear on the flood zone map at all. The same pattern is showing up at heritage sites across Britain. Anyone developing in the city needs both questions answered, which is what a flood risk assessment in York is for.
What York teaches anyone building near a river
York is a useful case precisely because it has been studied, funded and rebuilt more thoroughly than almost anywhere else. Three lessons transfer to any riverside site in England.
Look at the catchment, not the site boundary. York’s flood peak is made in the Dales, days earlier and the better part of a hundred kilometres upstream, which is why nothing about the site itself would have predicted 4 November 2000. Understanding main rivers and ordinary watercourses across the whole catchment matters more than the watercourse you can see from the plot.
Defended is not the same as safe. Every defence has a design standard and a failure mode, and it is the failure mode an assessment has to plan for, because finished floor levels, safe access and escape and resilient construction all exist for the day the wall is overtopped rather than the years it holds.
Design for the water you cannot send to the river. When the Ouse is high, nothing drains into it. That is when a site’s own surface water drainage strategy, meaning storage, controlled discharge and a routed exceedance path, decides whether the development floods.
If you are planning a development in York or anywhere else on the Ouse catchment, Unda prepares flood risk assessments and drainage strategies for planning, property purchase, insurance and BREEAM. Call 01293 214444 or start a quote online for a fixed fee within the hour.
York flooding: frequently asked questions
What river runs through York?
Two. The River Ouse is the main and largest river in York, formed upstream where the Swale, Ure and Nidd converge, and it is tidal as far as Naburn Lock. The much smaller River Foss joins it inside the city walls at Blue Bridge. Almost all of York’s river flooding involves both.
How deep is the River Ouse at York?
The Environment Agency’s Viking Recorder gauge measures river level, not depth, and its normal range is 0.05 to 1.90 metres above the station datum. Actual depth through the city centre reach varies with the tide and the state of the river, and is maintained for navigation upstream of Naburn Lock. For flood purposes the level reading is the number that matters, not the depth.
When did York last flood?
Most recently in the winter of 2025, when Storm Claudia in November put water over the riverside walkway at King’s Staith and Storm Bram in December brought further flood warnings across North Yorkshire. Neither came close to the 2000 record. That is the point: York’s riverside floods at levels the Ouse reaches routinely.
Does the flood map show whether a York property is protected by the defences?
No. The Flood Map for Planning is drawn as though defences were not there, so a property directly behind a new floodwall can still sit in Flood Zone 3. The map tells you where water would go, not what stands in its way, and working out the difference is a site-specific exercise.
How much warning does York usually get before the river peaks?
More than most flood-prone towns, because the water has to travel down from the Dales. The lag between rainfall over the Swale, Ure and Nidd and the peak arriving at York gives the Environment Agency a forecasting window measured in days rather than hours, which is why York’s flood warnings are unusually reliable, and why the river often peaks in bright weather.
About the author. Jackie is a co-founder and Director of Unda with 30+ years in flood risk, and sits on CIWEM’s South Eastern Branch committee. Unda has been trading since 2014, is a CIWEM Business Partner with CIWEM member and chartered (C.WEM MCIWEM) consultants, and has delivered 5,000+ flood risk assessments and drainage strategies across England and Wales.
Jackie Stone · MSci, BSc (Hons), DIC, CIWEM Environmental Partner
Latest news



One of our experienced Flood Risk Consultants will get back to you within 60 minutes