The great floods of 1947: 690,000 acres under water, and what the record still doesn’t show
Estimated reading time 22 minutes
In March 1947, rapid snowmelt onto ground that had been frozen for six weeks produced the largest river flood England has seen in the last hundred years. At the peak, the Minister of Agriculture told the Commons, 690,000 acres were under water. Thirty of England's forty counties were affected. The 1947 floods reached more land than any event before or since. They also killed almost nobody, which is most of the reason you have probably never heard of them.
The Thames peaked at 714 cubic metres a second, still the largest gauged discharge in the river's instrumental record.
That figure comes from Macdonald and Sangster's 2017 reconstruction of British high-magnitude floods, and it is the same number the Environment Agency has long expressed as 61.7 billion litres a day. Neither figure appears anywhere in the popular accounts of the event.
There is a second reason 1947 matters to anyone doing flood risk work today, and it is stranger than the first. The event is only partly present in the national record. The Environment Agency's Recorded Flood Outlines dataset holds 1,233 outlines dated to 1947. That is more than every pre-1947 record in England put together. Dissolve them and they cover about 412,600 acres. That is roughly sixty per cent of what Parliament was told went under. In parts of the Fens, where the flooding was photographed, debated in Hansard and remembered in parish records, the mapped extent is a single polygon that was assessed and then rejected. If you are commissioning a flood risk survey before a property purchase, that gap is not an academic curiosity.
The winter that made it possible
The 1947 floods were made in January and February, not March. The Met Office's own account of the winter of 1946–47 records a February with a mean maximum temperature of 0.5°C, nearly seven degrees below average, and a low of −21°C at Woburn in Bedfordshire on 25 February. Snow fell somewhere in the United Kingdom every day for fifty-five consecutive days.
- Continuous cover. Snow lay over much of the country, from Kent to Orkney, for the whole of February, at average depths commonly over half a metre, on the Centre for Ecology and Hydrology's account of the period.
- Drifts. By 6 March, five metres in the Pennines and three metres in the Chilterns.
- The deepest reading. 210 centimetres at Forest-in-Teesdale on 14 March, still the deepest snow recorded at an inhabited British location.
- Frost days. Thirty consecutive days of frost at Buxton, with no sunshine at all at Kew between 2 and 22 February.
The country was already broken by it before a drop of the meltwater moved: three-quarters of a million railway wagons of coal sat immobilised, industry was shut down for three weeks, and up to four million people were claiming unemployment benefit while Buckingham Palace and the Houses of Parliament worked by candlelight. Power came back to British industry one minute after midnight on 3 March. The thaw began six days later.
What matters hydrologically is how long the cold lasted rather than how deep it went, because six weeks of hard frost turns the top of the soil profile into something closer to concrete than to soil. Then the snow above it goes. The ground beneath cannot take the water.
Why frozen ground turns a thaw into a flood
Frozen ground floods because it stops behaving like soil. It behaves like a roof. Infiltration capacity falls towards zero, so the runoff coefficient climbs towards one across an entire catchment at the same moment. The Centre for Ecology and Hydrology's appraisal of the 2000/01 floods describes 1947 in one line: a snowmelt-generated event which produced very high runoff rates over still-frozen ground.
This is worth separating from a mechanism it is often confused with. Frozen ground is a surface condition, a thin impermeable lid stopping water entering the soil at all. Groundwater flooding is a subsurface condition, where the water table rises to meet the ground from below. The two produce similar-looking water in similar-looking places, they are routinely conflated in objections and in poorly written assessments, and they need entirely different investigation to establish which one you are actually dealing with.
Four things compounded in March 1947, and only the first appears in most retellings.
- Stored water released at once. A metre of settled snowpack holds a great deal of water. A normal British thaw releases it over weeks; this one released it over days.
- Rain on snow. From 11 March, rain replaced snow. Warm moist air condensing onto a ripe snowpack melts it far faster than sunshine does, and the gale of 16 March drove that heat exchange harder still.
- Nowhere for it to go. With infiltration effectively switched off, almost all of it became surface runoff within hours.
- Everything peaked together. Because the thaw was national, tributary peaks arrived simultaneously instead of staggering. Hydrographs superposed rather than attenuated, which is why the Thames, Severn, Trent and Great Ouse all flooded inside the same fortnight.
That last point is what makes 1947 different in kind rather than degree from an ordinary fluvial flood, where a storm tracks across the country and the catchments it crosses respond in sequence as it passes. A rainfall event is bounded by a weather system. A national thaw is bounded by nothing.
The thaw, day by day
The flooding ran from 9 to 24 March 1947 and moved across the country in five distinct waves, starting in the south-west and finishing in Yorkshire. The sequence is unusually well documented, for the simple reason that after eight weeks of snow the whole country was already watching the weather.
- 9 March, the thaw begins. Temperatures climb towards 10°C after six weeks below freezing.
- 11 March, rain replaces snow. The first flooding is reported in Somerset, Kent and the Medway and Great Stour catchments.
- 14–15 March, the Thames goes. Flooding along the Thames and its tributaries, and across north-west and north-east London. A depression arriving on 15 March opens what became the wettest March in three hundred years.
- 16 March, the gale. Winds over southern England average around 50 knots with gusts of 80 to 90, the Met Office recorded. The Lea Valley peaks; contamination of the filter beds cuts the water supply to more than a million people. Fen banks breach.
- 17–19 March, the Midlands. The Severn, the Wye and the Trent. The Trent bank bursts at Nottingham on 18 March.
- 18–24 March, Yorkshire. The Wharfe, the Derwent, the Aire and the Yorkshire Ouse. The Severn at Tewkesbury peaks overnight on 21 March.
Eleven days, four major river systems, thirty counties.
Where the water went: the four great catchments
The flooding was national but not uniform. Four catchments carried most of it, and the differences between them come down to where the snow had been lying and how far the meltwater had to travel before it met a town.
| Catchment | Peak | What flooded | Recorded properties |
|---|---|---|---|
| Thames | 14–17 March; 714 m³/s, the largest gauged discharge on record | Maidenhead, Windsor, Staines, Caversham and Reading, Oxford | c. 1,400 Maidenhead; 1,350 Windsor; 1,600 Caversham and Reading |
| Trent | 18 March, bank failure at Nottingham | Nottingham, West Bridgford, Long Eaton, Beeston, Newark, Derby | c. 14,000 across the Nottingham district; 2,000 West Bridgford |
| Severn | 21–22 March; 7.72 m above the lock cill at Gloucester | Gloucester, Tewkesbury, Bewdley and Tenbury in Worcestershire | Gloucester's 1852 record of 25 ft 4 in beaten by three inches on 21 March |
| Great Ouse and the Fens | 16–18 March, successive bank and sluice failures | Denver, Southery, Hilgay, Hockwold, Lakenheath; farmland across Cambridgeshire, Peterborough and Lincolnshire | 40,000+ acres submerged in the South Level alone; 150,000 acres out of cultivation |
The Severn figure is the one to sit with. In July 2007 the river reached exactly the same level at Gloucester, 7.72 metres above the lock cill. But in 1947 the canal peaked eight days before the river, because the water was coming off the Welsh mountains as melt; in 2007 the gap was three days, because it was rain on an already-saturated catchment, the same pattern that produced the Severn floods of autumn 2000. Same peak, different machine. Upstream at Tewkesbury, the Mythe Works gauge reached 21 ft 11 in against a normal summer level of 6 ft 6 in, and the town recorded its most extensive inundation since 1852.
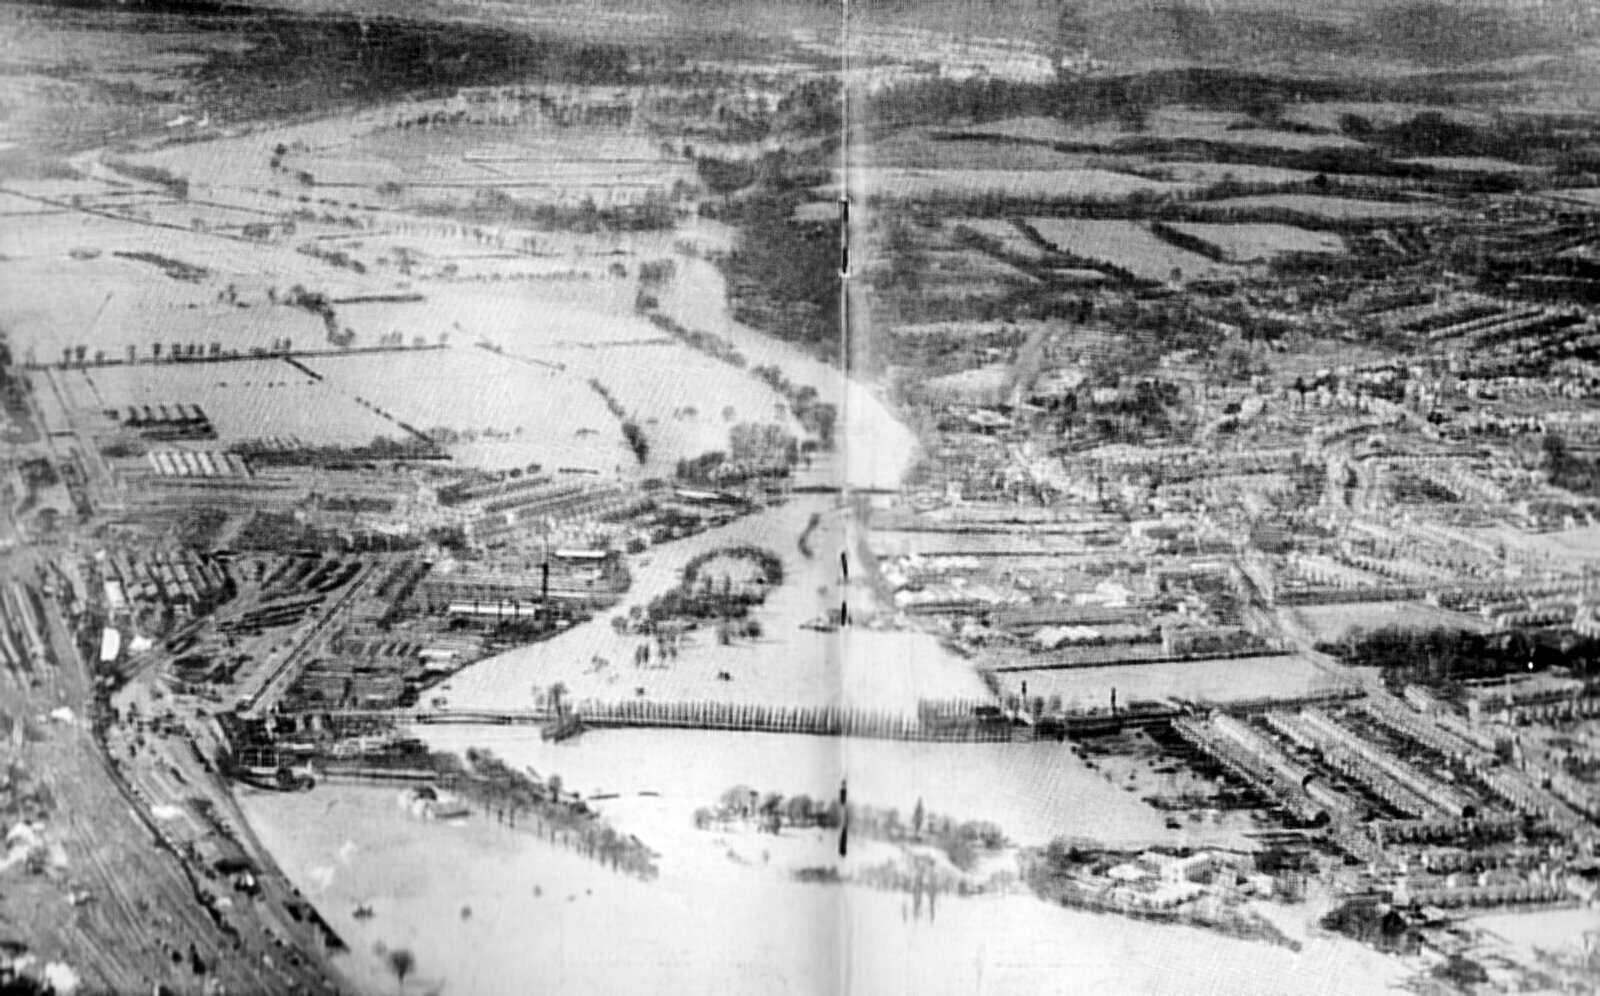
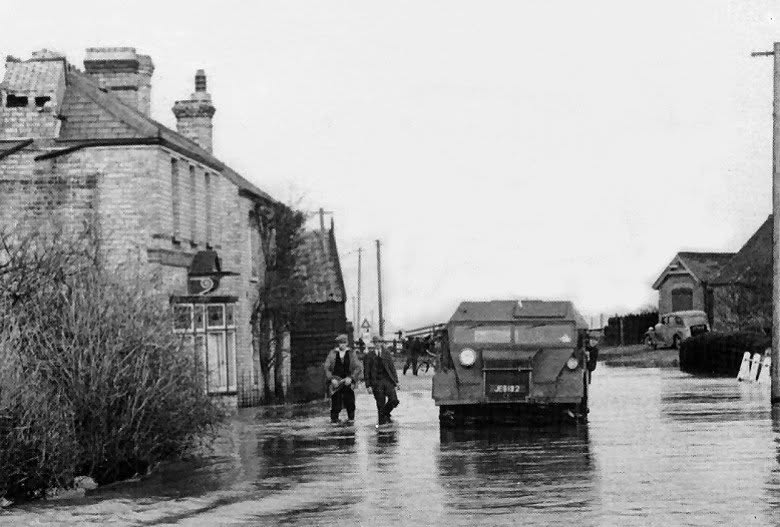
Elsewhere, the pattern held. In Lincolnshire, around 3,000 houses in Lincoln were affected. The city's MP told the Commons so, and the Minister acknowledged it. Selby lost more than seventy per cent of its properties. At Doncaster, Bentley took 830. The Fen defence effort ran to 550,000 sandbags, 200 pumps including seventeen shipped from Holland, 700 commandeered lorries and 126 barges carrying 11,000 tonnes of clay. The modern Fens flood management programme still has to plan around that scale of failure.
What the Commons was told in April 1947
Six weeks after the water peaked, the House of Commons debated the floods. The exchange is the single best source on the event and on the official response to it, and it repays reading in full.
At one period we had no less than 690,000 acres under water. The House may be interested to learn that these 690,000 acres have now been reduced to 80,000.
Tom Williams MP, Minister of Agriculture, House of Commons, 24 April 1947
The debate also fixes several figures the secondary literature muddles. The National Farmers' Union assessed the damage at £20 million in capital losses alone, excluding loss of livelihood. In the South Level of the Great Ouse, more than 40,000 acres of arable land were submerged; the Black Sluice pumping station was clearing water off around 100,000 acres. A Cambridgeshire member put 150,000 acres out of cultivation for that year and probably much of the next.
It also carries the flood's sharpest political moment, when the member for Holland with Boston complained that "hundreds of good English workmen, farm workers" were out of work while German prisoners of war were being brought in by lorry, from a long distance, to work the breaches. Two years after the war, the Fen banks were being repaired by the people Britain had just defeated.
What it does not contain is any commitment to change anything.
Why the 1947 floods changed almost nothing, and 1953 changed everything
There is a line repeated across the internet that the River Boards Act 1948 was Parliament's answer to the 1947 floods. Hansard contradicts it, in the debate on the floods themselves, in terms that leave no room for a generous reading.
Major Legge-Bourke, the member for the Isle of Ely, had suggested the River Boards Bill then before Parliament might affect the Fens. The Minister of Agriculture replied that the Bill was "merely designed to combine the main Catchment Boards with Fishery Boards and pollution authorities, which will neither extend nor contract their drainage responsibilities."
The largest river flood of the century, and the legislation before Parliament that year was explicitly not a response to it.
The Bill's own second reading confirms it. Moving it in the Lords that November, the Earl of Huntingdon described a simple measure of administrative reform resting on a Central Advisory Water Committee report presented to Parliament in August 1943, four years before the flood. He said plainly that it took no new powers: "we do not propose to alter the law or to take any new powers. That will have to come later." What it did was merge 45 fishery boards, 53 catchment boards and some 1,600 pollution authorities into a smaller number of river boards. It was a tidying exercise, and it had been designed during the war. The line runs from the Land Drainage Act 1930 through 1948 to the 1991 Act that internal drainage boards still operate under.
Nor was there an inquiry. There was a committee already sitting; there was a new inter-departmental committee organising manpower and equipment during the emergency; there was a request for inquiries, which the Minister undertook to "consider". What the Government actually published, in 1948, was The Official Story of the Great Floods of 1947 and Their Sequel Harvest Home, a ninety-five page illustrated account of the recovery prepared by the Central Office of Information. A picture book.
One piece of legislation did follow, and it is worth being precise about it: the River Great Ouse (Flood Protection) Act 1949, a Local Act, which enacted a scheme Sir Murdoch MacDonald had designed in 1940 after the Fen floods of 1936, 1937 and 1939. The only statutory response to the largest flood of the century was catchment-specific and had been drawn up seven years before it happened.
Six years later, the North Sea storm surge of 31 January 1953 killed 307 people in England. A flood warning service was operating on the East Coast the following winter, on the strength of an interim report. The Waverley Committee's full report was published on 3 June 1954, about sixteen months after the event. It set a standard of protection, which the Government accepted. It recommended investigating a structure across the Thames that could be closed against a surge. That became the Thames Barrier.
The difference between the two responses is not the size of the flood. It is the body count. 1947 put more land under water than any event in modern English history, drew a Commons debate and a government photobook, and changed nothing; 1953 killed 307 people in England and produced a warning service, a standard of protection and eventually a barrier across the Thames.
What the photographs record
1947 is one of the best-photographed floods in English history, and the photographs carry what the outlines do not. An outline records where the water reached. A photograph records how deep it stood, what it did to a building, and how people moved around while it was there. Some of it was official survey work. Most of it was not.
At Earith, a man called Walter Lane heard that the Great Ouse had breached, took a taxi from his home in Ely, and photographed the defence of the Old West bank while it was still going on.
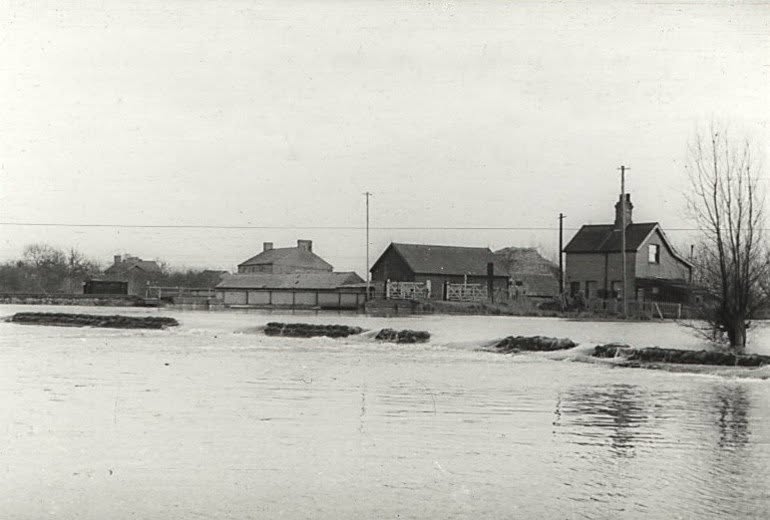
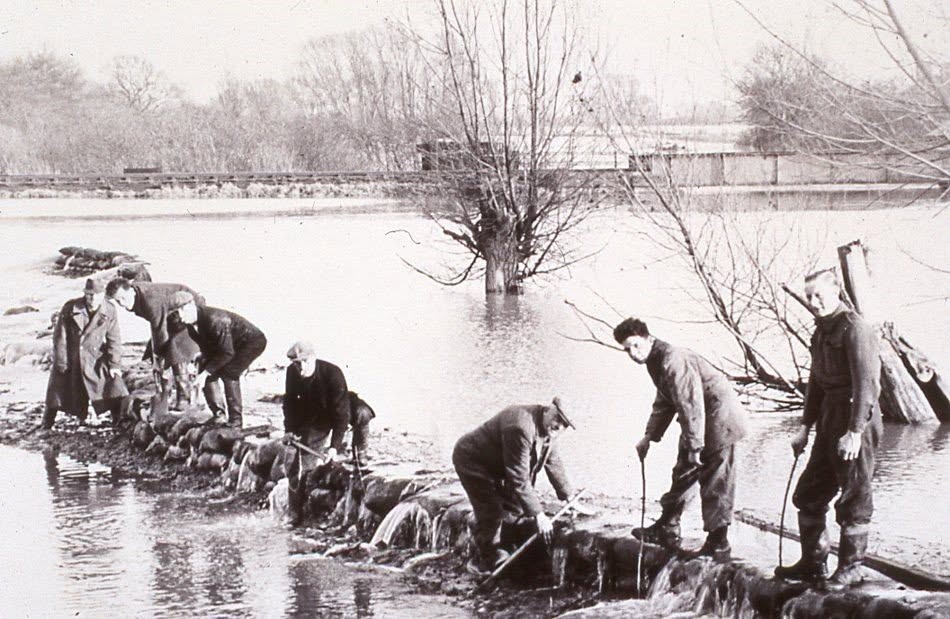
The distinction matters. Overtopping and breach are different failure modes with different consequences, and Lane caught the first one in progress: the water went over the sandbags, crossed the road and the river beyond, and dropped into Hillrow Fen. His collection is now held in the Cambridgeshire Collection at Cambridge Central Library.
Further north the record is domestic rather than documentary, and it is better for it.
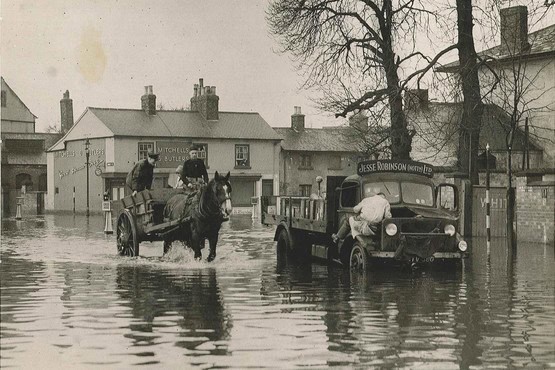
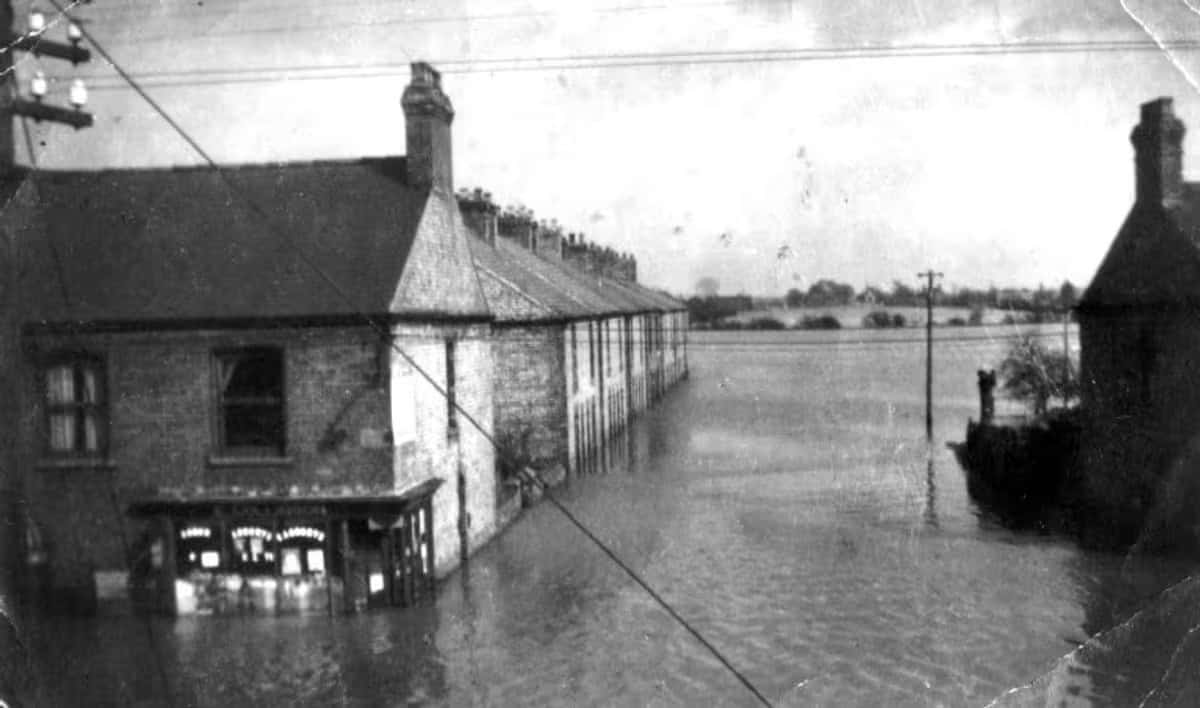
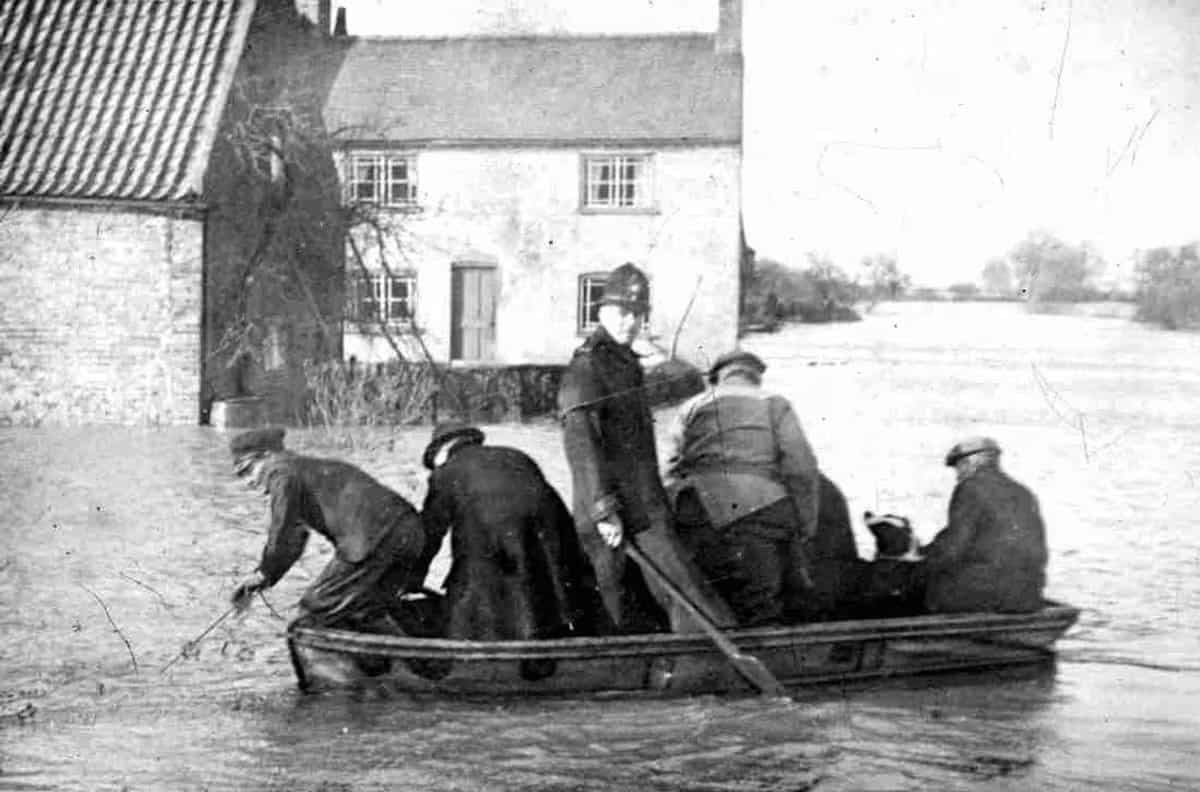
Misterton and Laneham survive in the Welchman Collection at Bassetlaw Museum, taken by someone who thought a flooded terrace and a boat in a village street were worth a plate.
Almost none of what those photographs record survives the journey into a dataset.
An outline is a polygon. It carries an extent, a date where somebody wrote one down, and very little else. It cannot tell you that the water stood against the frontages of a whole terrace, or that the defence at Earith held and was overtopped rather than breached, because those are not things an outline has room for. Where the published layers come back blank over a site, the county archive is not a consolation prize. It is frequently the only evidence there is.
Does 1947 show up in England's national flood data?
Partly, unevenly, and with almost no quality rating attached. That is the finding with practical consequences, because since March 2025 the record feeds the planning map rather than sitting beside it.
The Environment Agency's Recorded Flood Outlines dataset holds every confirmed historic flood record from rivers, sea and groundwater springs; the Historic Flood Map is the filtered subset that meets its inclusion criteria. The agency's own guidance states that the majority of records began in 1946. So 1947 sits at the very opening edge of the national record, and it carries a caveat every practitioner should be able to quote:
If an area is not covered by the Historic Flood Map it does not mean that the area has never flooded, only that we do not currently have records of flooding in this area that meet the criteria for inclusion.
Environment Agency, Historic Flood Map dataset guidance, version 6.2
Querying the agency's public Recorded Flood Outlines service on 3 September 2026 returns a picture that is impressive in bulk and thin in detail.
- 1,233 outlines carry a 1947 date. More than every pre-1947 record in England combined, and nearly three times the whole of 1948 to 1959. For scale, 1953 returns 61 and 2007 returns 2,741.
- Only about 200 carry a real date. Some 698 of the 1,233 are dated 1 January 1947, a placeholder for "1947, day unknown", with a further 332 on the first of March or April.
- Ninety-five per cent carry no quality rating at all. Of the remainder, 55 are rated Fair and 10 Poor. None is rated better than Fair.
- The mapped area is about 412,600 acres. Dissolved, the outlines cover 1,670 square kilometres, roughly sixty per cent of the 690,000 acres Parliament was told had gone under.
- The Historic Flood Map itself carries no dates. The published service has four fields, none of them a date. It is a dissolved maximum envelope, so it cannot tell you which event produced an outline.
The Fens are the sharpest case. Across a box covering the Norfolk and Cambridgeshire Great Ouse fens, the entire 1947 record is one polygon of 2.51 square kilometres, source "unknown", cause "unknown", and marked considered and rejected, meaning it does not appear in the Historic Flood Map at all. The 1953 coastal outline in the same box runs to 138.8 square kilometres and was accepted. Southery, Hilgay, Denver, Downham Market, Littleport, Ely, King's Lynn and Boston have no 1947-dated outline within six kilometres of their centres, which is a statement about the Environment Agency's record-keeping in 1947 rather than about what happened to those places.
The breaches that consumed 550,000 sandbags and 126 barges of clay are represented in the national flood map by nothing.
This used to matter less. Since 25 March 2025 the Flood Zones have been derived from NaFRA2, which combines national modelling, local models and Recorded Flood Outlines. The historic record no longer sits alongside the planning map; it feeds it. So where the 1947 record is blank, the blank propagates. It is one more reason a site can screen as low risk without ever having been safe.
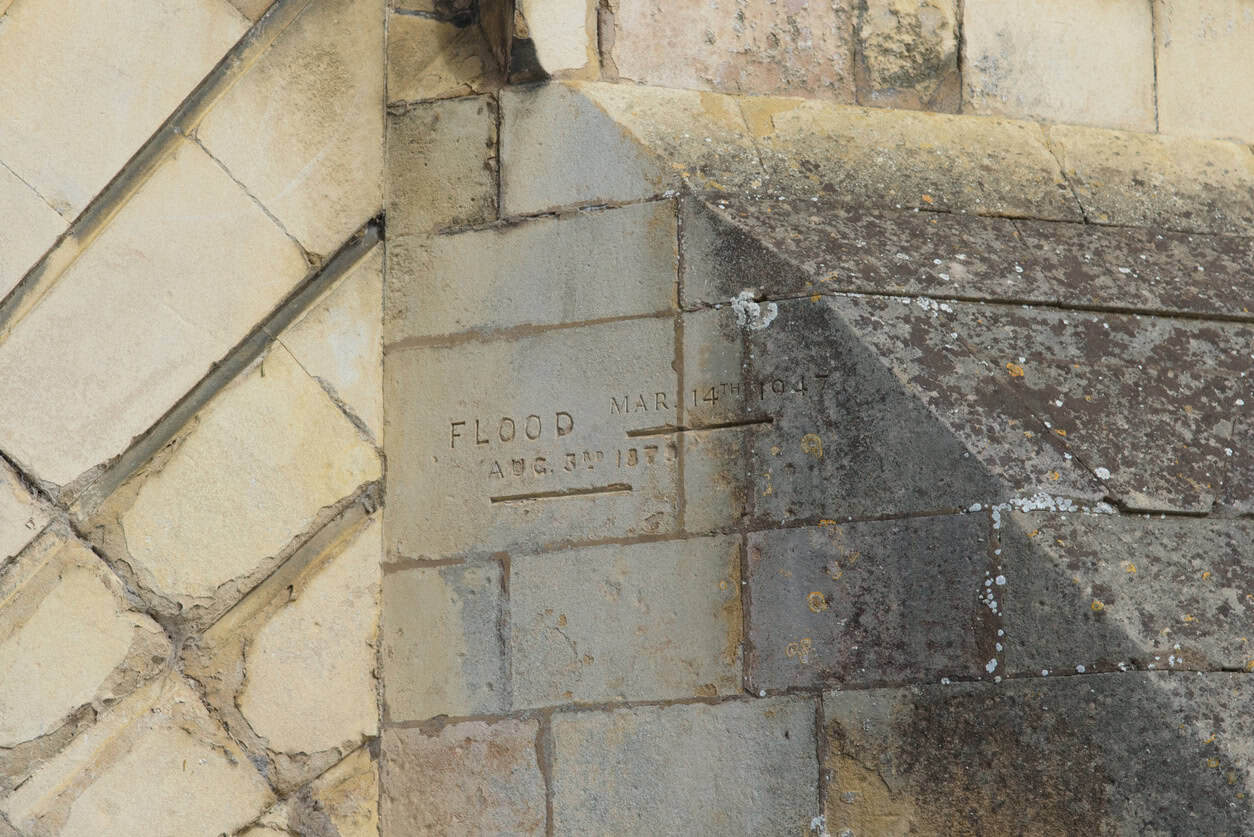
Towns that lived with flooding used to record it on the buildings themselves, at the height the water actually reached, in a form that needs no dataset and no login. Those marks are still there, and they are still accurate. A good number of them stand over ground the published layers now show as carrying no record at all.
For anyone doing flood risk due diligence on a site in one of these catchments, the practical rule is short. A 1947 outline over your site is strong evidence and should be treated as such. The absence of one is not evidence of anything. An Environment Agency Product 4 request, which returns historic records the published layers omit, is the correct next step, alongside the flood mapping tool and local archive sources.
What a 1947-type event would do now
Risk Management Solutions modelled the question for the sixtieth anniversary and put insured losses at £4.5 to £6 billion, with a central estimate of £5.3 billion and around 95,000 properties flooded under a realistic defence scenario. With no defence improvements at all, the figure is 276,540. The same study notes that roughly half of all post-war British housing has been built in flood-prone areas.
The harder problem is that the mechanism is not represented in the way flood risk is normally assessed. The Flood Estimation Handbook methods do not specifically include snowmelt, as the Centre for Ecology and Hydrology's own author states. The Environment Agency's Flood Estimation Guidelines mention snow exactly once, in a method-statement checklist: "Is the catchment likely to be vulnerable to snowmelt floods?" The guidance asks the question and then offers no method, no adjustment and nothing further. The climate change allowances cover peak river flow, peak rainfall intensity, sea level rise, offshore wind speed and extreme wave height. Snow is not among them.
None of this is an argument that every assessment should model a thaw. It is the same reasoning failure Unda described after the Bhote Koshi disaster in Nepal: the datasets were sound, and they were pointed only at the hazards someone had already catalogued.
There is a genuine counter-argument, and RMS makes it: because the root cause was extreme snowfall, a warming climate makes this specific type of event less likely. Projected reductions in snowfall days by the 2080s run from 55 per cent in western Scotland to 85 per cent in southern England. But the same research warns that there will not automatically be a reduction in the overall impact of snow, because preparedness falls faster than hazard does. A country that has not seen a national thaw flood in eighty years is not a country that has solved one. It is a country that has stopped rehearsing.
Frequently asked questions
Was 1947 a worse flood than 1953?
They are not comparable on a single measure, which is why both get called the worst. 1947 covers far more ground: 690,000 acres against a coastal inundation, and the highest ten-day and thirty-day national river outflows the Centre for Ecology and Hydrology has ranked since 1940. 1953 was far deadlier, killing 307 people in England against no recorded national toll for 1947. Different mechanisms, different geographies, different kinds of damage.
Could a flood like the 1947 floods happen again?
Less easily, but the mechanism has not been retired. It needs a deep, sustained snowpack sitting on frozen ground, then a rapid thaw with rain on top. A warming climate makes that combination rarer rather than impossible. The residual concern is not frequency but preparedness: no British catchment has been tested this way in living professional memory, and the standard design-event framework does not represent it.
How do I find out whether a site flooded in 1947?
Start with the Environment Agency's Recorded Flood Outlines, which carry event dates the Historic Flood Map does not. Where those are blank or placeholder-dated, request Environment Agency Product 4 under the Environmental Information Regulations. It returns historic records the published layers leave out, free, within twenty working days. County archive services, parish records and the Britain from Above aerial collection, which photographed flooded Maidenhead on 19 March 1947, often hold evidence that never reached a national dataset.
Why is 1947 missing from most lists of Britain's worst floods?
Because those lists are usually ranked by deaths. Sky HISTORY's five worst modern UK floods omits 1947 entirely while including the 1928 Thames flood, which drowned fourteen. Casualty-count framing systematically under-weights the largest-area event in modern English history, and it is the same framing that explains why 1947 produced no reform.
Did the 1947 floods cause food rationing?
They contributed to it. Potato rationing was introduced in November 1947, and the Minister of Food told the Commons that flood conditions had made the planting target impossible, with at least 80,000 acres lost. He also blamed the very hot summer that followed, and the yield was the lowest since 1931. Flood and drought in the same year, in a country still rationing bread.
The 1947 floods are worth knowing about for the obvious reason. They are the largest river flood in modern English history and almost nobody has heard of them. They sit alongside the great flood of 1968 as one of the two inland events that still shape what English rivers are known to be capable of. They are worth knowing about professionally for a different reason. They sit at the opening edge of the national flood record, they are recorded unevenly and rated poorly, and since March 2025 that record feeds the planning map directly. A blank on the map over a place that demonstrably drowned in 1947 is a gap in the data, not a finding about the site.
If you are assessing a site in the Thames, Trent, Severn or Great Ouse catchments and the published layers look clean, it is worth asking what the record actually contains. Our flood risk consultants work with Environment Agency Product 4 data, archive sources and local records as a matter of routine. Call 01293 214444 or email enquiries@unda.co.uk.
About the author. Edward is a co-founder and Director of Unda with 20+ years in flood risk and drainage, and a national-press commentator on flooding. Unda has been trading since 2014, is a CIWEM Business Partner with CIWEM member and chartered (C.WEM MCIWEM) consultants, and has delivered 5,000+ flood risk assessments and drainage strategies across England and Wales.
Edward Bouët · BSc (Hons)
Latest news


One of our experienced Flood Risk Consultants will get back to you within 60 minutes
