Glacier Collapse, Not a Glacial Lake Outburst Flood: What Happened in Nepal
Estimated reading time 32 minutes
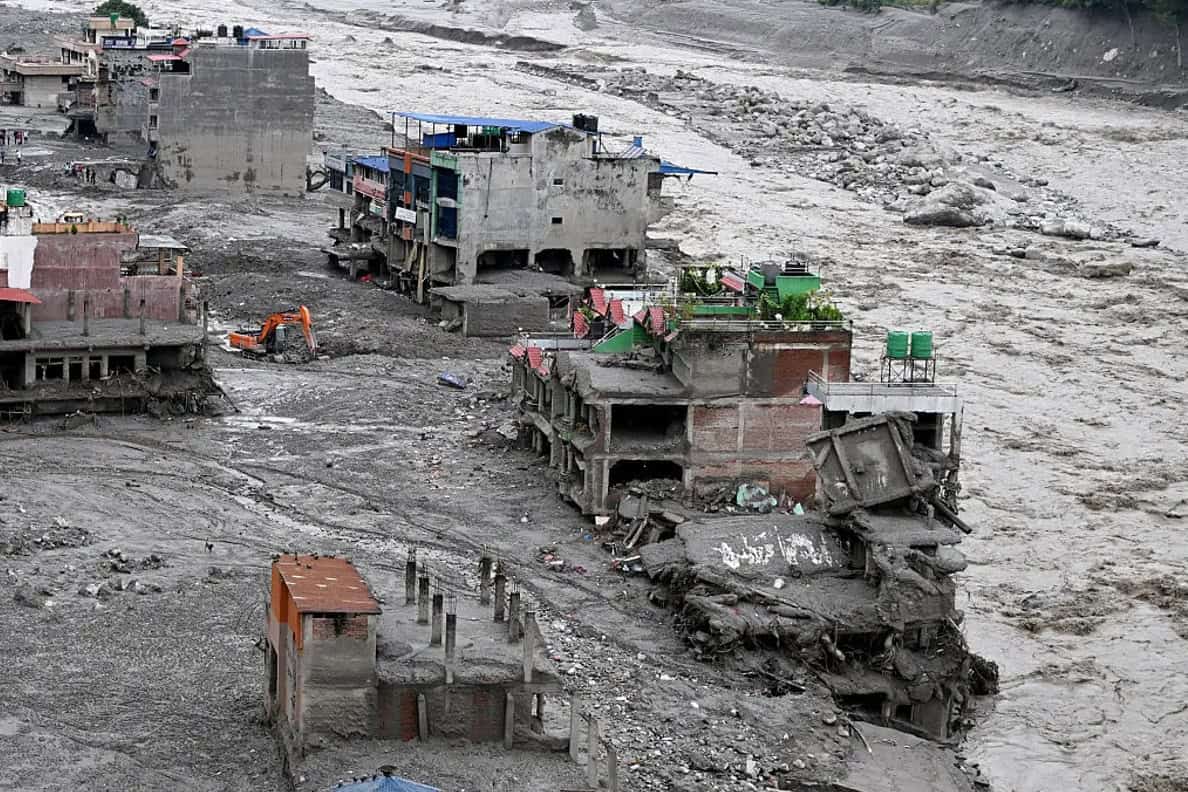
At 08:37 on 26 August 2026, a mountainside in the Langtang Himal gave way. Seven minutes later a wall of rock, ice and liquefied sediment crossed the Nepal-China border twenty-two kilometres away, moving at close to 190 kilometres an hour. Most of the coverage has called it a glacial lake outburst flood.
A flow like that is not a drowning hazard in any ordinary sense. In the first week, sixty of those recovered had been identified and returned to their families. Some seven hundred were buried after a DNA sample was taken, because there was nowhere cold enough to keep them and no other way to name them.
Nearly four thousand people are still missing. Several hundred of them are inside hydropower tunnels that filled with mud and cannot be entered. Others were carried 150 kilometres downstream, and thirteen were recovered from a river in India. Many will never be found at all.
What is a glacial lake outburst flood?
A glacial lake outburst flood is the sudden release of water from a lake dammed by glacier ice or by the loose rock and debris a glacier has left behind. The dam fails, and the lake empties downstream over minutes or hours instead of draining slowly. Across the Hindu Kush Himalaya, the glacial lake outburst flood is the defining mountain flood hazard, and it is the hazard that monitoring, mapping and early warning have been built around.
On the morning of 26 August 2026, a flood came down the Bhote Koshi valley on the Nepal–China border and killed more than a thousand people. It was not a glacial lake outburst flood.
Understanding why not is the most useful thing a British flood risk practitioner can take from it. Nepal was not unprepared. It had inventories, satellite monitoring, a warning system and international scientific support. All of it was pointed at glacial lakes. The flood came off a rock face that nobody had catalogued, and the consequences of that mismatch are still being counted.
What happened on the Bhote Koshi on 26 August 2026
At 08:37 local time, a mass of bedrock carrying a hanging glacier detached from the north face of the Lirung massif in the Langtang Himal, at roughly 5,200 metres. It fell about 1,200 metres into the head of the Lhende Khola, a tributary of the Bhote Koshi. The collapse generated a seismic signal strong enough that it was first logged automatically as a magnitude 4.4 earthquake.
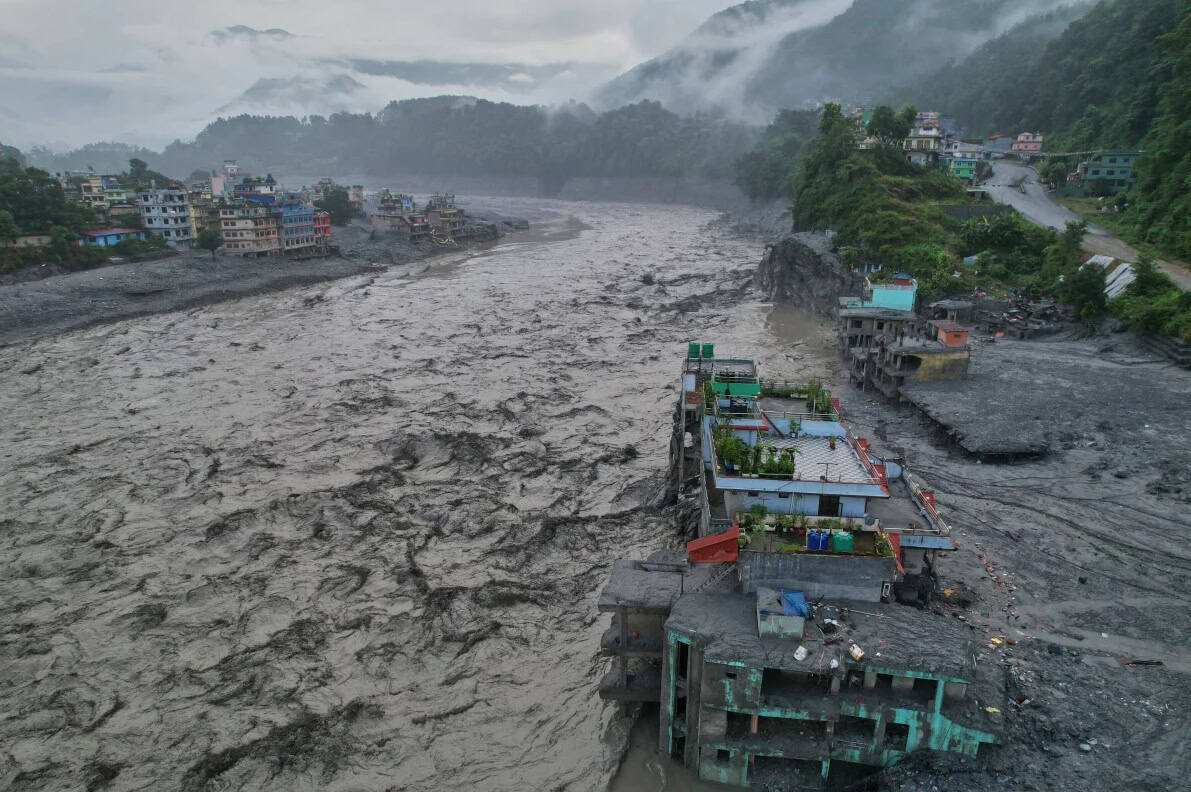
Seven minutes later the flow reached Gyirong Port on the Chinese side of the border, 22 kilometres downstream, having averaged something close to 190 kilometres per hour. It crossed into Nepal at Rasuwagadhi. There it destroyed the border complex, the trading village of Timure and the town of Syabrubesi, before running on down the Bhote Koshi into the Trishuli and the Narayani. Sediment was later traced roughly 100 kilometres downstream. The flood peak was recorded at Devghat, 168 kilometres from the mountain, at four o'clock that afternoon.
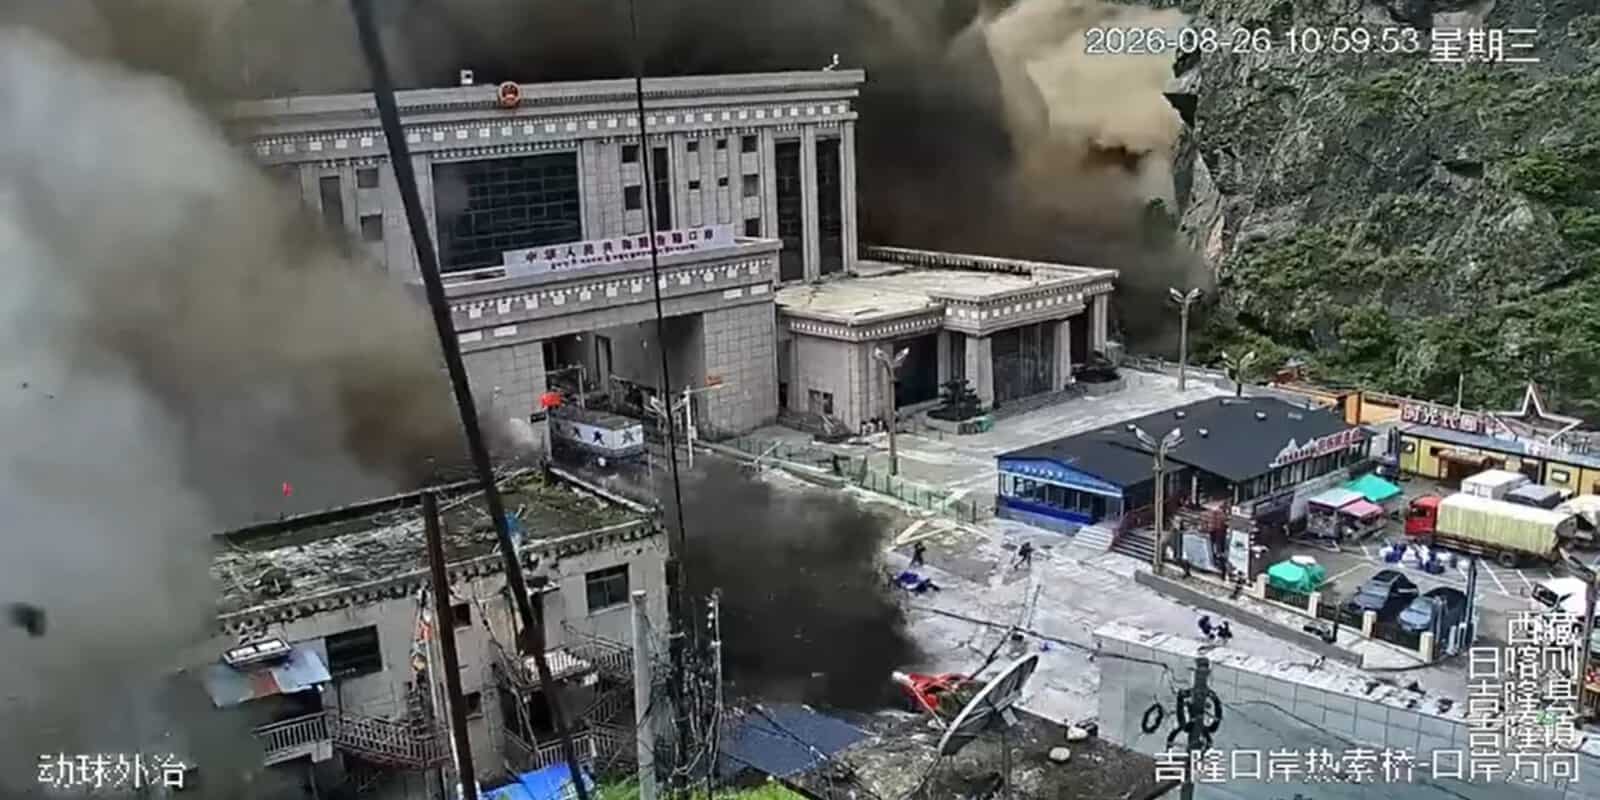
Much of it was filmed. For an event of this class, that is close to unprecedented: the initiating avalanche itself was captured on a drone camera. Footage of the flow arriving at the border settlements has been seen by most people who follow this subject. It is not easy to watch. It should not be.
One of those cameras settles a number. The port's own CCTV clock reads 10:59:53 China Standard Time, which is 08:44:53 in Nepal: seven minutes and forty-three seconds after the mountain failed, for a distance of twenty-two kilometres.
Video: "Did a glacier collapse trigger Nepal's deadly floods?", BBC News. Embedded from YouTube, with all rights remaining with the BBC.
The figures below are as reported by Nepal's National Disaster Risk Reduction and Management Authority on 2 September 2026, seven days after the event, and they were still moving daily.
Something over eleven hundred bodies had been recovered. Nearly four thousand people were still missing. Around twelve thousand had been rescued.
Those numbers understate what happened. Identification has been slow and in many cases will not be possible at all, which is why so many burials went ahead on DNA evidence rather than a name. Bodies were found 150 kilometres downstream, and thirteen were recovered from the Gandak in Uttar Pradesh, across the Indian border. The recovery pattern ran overwhelmingly downstream: by 2 September, 348 bodies had been recovered in Chitwan and 367 across the two Nawalparasi districts, against 41 in Rasuwa, where the flood struck. At the hydropower sites, several hundred construction workers remain inside tunnels that filled with mud; one company executive said simply that the tunnel could not be entered.
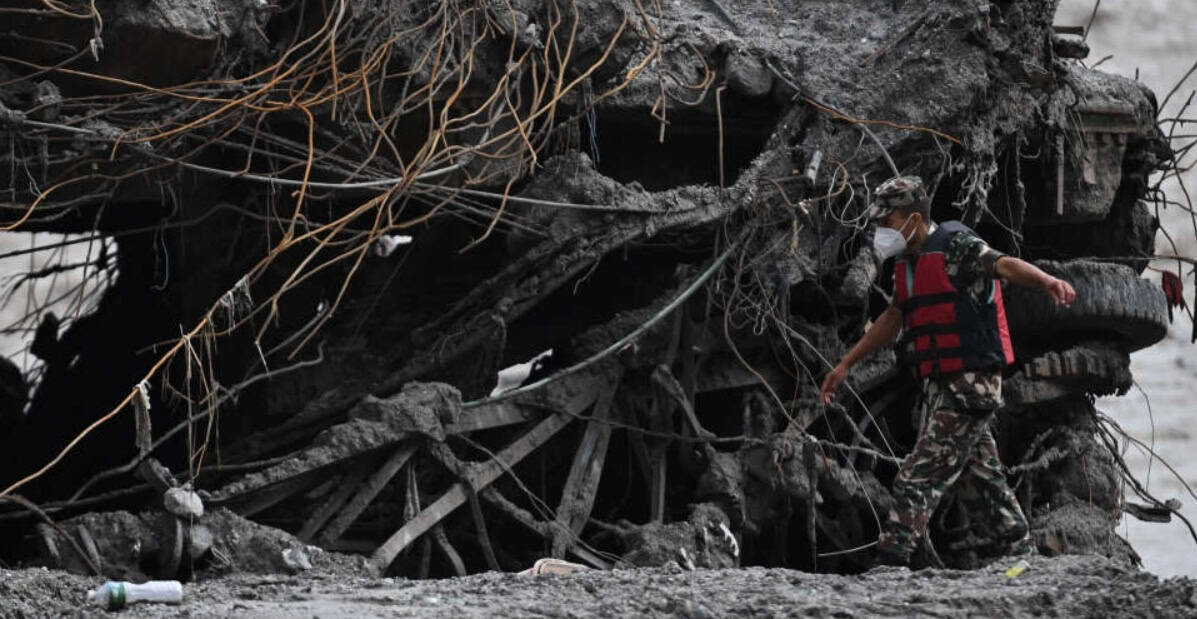
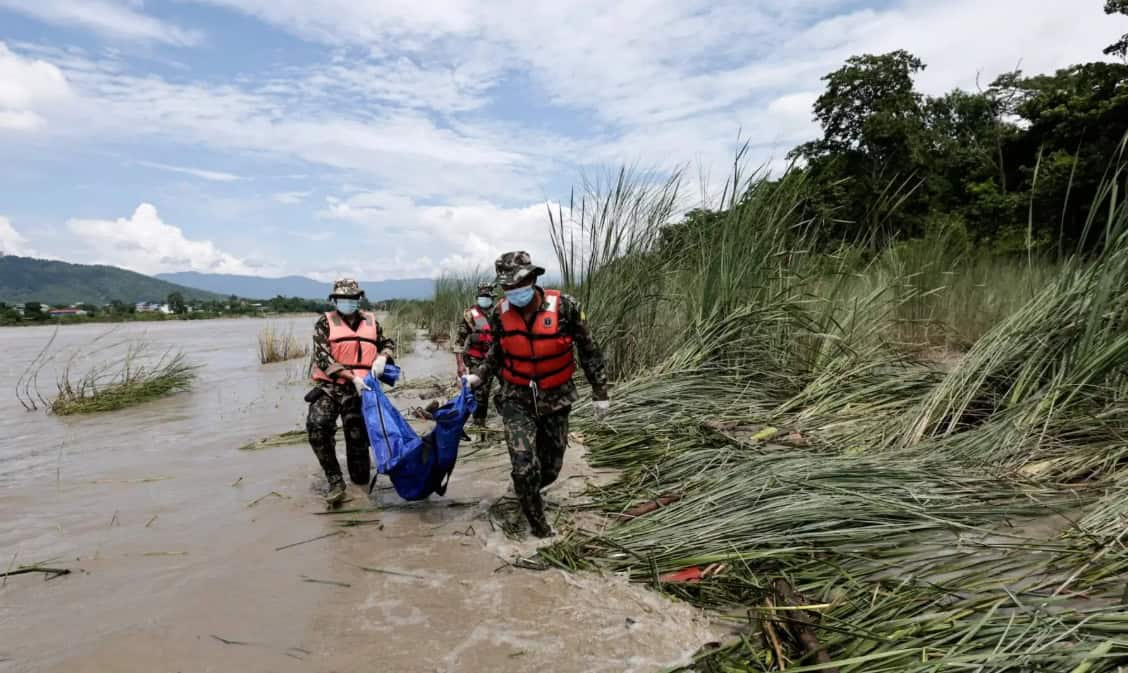
This is what a sediment-charged debris flow does that clear water does not. A flood that arrives at fifty metres per second carrying rock, ice and entrained moraine is not a drowning hazard in any ordinary sense. Many of the missing will never be found, and a substantial number of those recovered will never be named. That is the difference between water and what came down the Lhende Khola, and it is the same difference, in kind though nowhere near in degree, that sits at the centre of the technical argument in this article.
Why a UK flood risk consultancy is writing about a Himalayan flood
Let us be straightforward about the interest. We assess flood risk for planning applications in England and Wales. Nothing remotely like the Bhote Koshi event can happen here. Britain has no 7,000-metre peaks, no hanging glaciers and no permafrost slopes to lose.
What transfers is not the hazard. It is the reasoning failure.
Nepal did not fail to model glacial lake outburst floods. It modelled them well. The International Centre for Integrated Mountain Development had identified 47 potentially dangerous glacial lakes affecting Nepal and more than 200 across the wider region. Satellite monitoring watched them. What nobody watched was the rock slope above an uninventoried tributary, because rock slopes were not on the list.
Every flood risk assessment in this country works from lists too. Flood Zones, the surface water map, reservoir inundation extents, the National Flood Risk Assessment. Those catalogues are good, they are getting better, and they carry a quiet risk: over time, a catalogue stops describing the hazards someone has mapped and starts standing in for the hazards that exist. Everything outside it becomes residual. In practice, residual often means unexamined.
That is a live issue in British practice, and the sections that follow work through three places where it shows: what our models assume about the water they route, what we assume about warning time, and what we do after a site has already flooded once. If you are preparing a scheme and want that reasoning applied to a real site, our flood risk assessment for planning service is built around exactly these questions.
How a glacial lake outburst flood happens: four failure routes
Glacial lake outburst floods are not a single mechanism. Four routes account for most recorded events, and they behave differently enough that lumping them together causes problems.
Moraine-dam failure. A retreating glacier leaves a ridge of unconsolidated rock and sediment behind it. Water ponds against that ridge. The moraine is porous, unengineered and often ice-cored, and it fails by overtopping, by piping through its own body, or when a wave generated by an ice or rock fall into the lake surges over it. The Bhotekoshi flood of July 2016 was a moraine-dam event, releasing between 110,000 and 170,000 cubic metres.
Ice-dam failure. A glacier blocks a valley and impounds water directly against the ice. These lakes tend to drain and refill on a cycle as the ice floats, fractures or melts a conduit through itself.
Supraglacial lake drainage. Meltwater ponds on the glacier surface and finds a route through or beneath the ice. The July 2025 flood in this same valley, fourteen months before the 2026 disaster, was traced to a supraglacial lake outburst in Tibet, around 36 kilometres upstream.
Cascading triggers. An avalanche, rockfall or landslide enters a lake and displaces it. The initiating event is not hydrological at all, and this is the category that blurs into what happened in 2026.
The common feature is that a body of impounded water exists, can be seen from orbit, can be measured, and can be watched. That is what makes glacial lake outburst floods tractable as a monitoring problem, and it is precisely what the 2026 event did not offer.
Why the Bhote Koshi flood was not a glacial lake outburst flood
A glacier did collapse. That part of the headlines is right, and this article does not dispute it. What did not happen is the thing the phrase "glacial lake outburst flood" actually describes: a body of impounded water, held back by ice or moraine, bursting through its dam. There was no lake.
The scientific consensus on that point formed quickly and has held. Dave Petley, writing on the day: "There is no evidence that this was a GLOF." Bethan Davies, the following day: "It does not appear at this time that this event involved a GLOF."
The rapid hazard assessment published on 28 August by HiRISK, working with the Asian Mountain Academic Alliance, the Stimson Center and China's Institute of Mountain Hazards and Environment, set out the chain explicitly: rock-ice avalanche, mobilisation in proglacial terrain, contact with the deposits left by the 2025 outburst flood, damming of the Lhende Khola, dam failure, flood surge. The most precise short label for it is a landslide-dam outburst flood.
The distinction is not pedantry. It determines what you would have had to be looking at to see it coming.
| Glacial lake outburst flood | The 26 August 2026 event | |
|---|---|---|
| Source | A mapped body of water | A bedrock slope with a hanging glacier |
| Visible in advance? | Yes: lake area and dam condition are measurable from satellite | Only through slope deformation, which nobody was monitoring |
| Inventoried? | Yes, 47 dangerous lakes identified for Nepal and 200+ regionally | No inventory of rock-ice avalanche source zones exists |
| Water source | The lake itself | Melted ice, water in entrained sediment, and the river |
| Warning basis | Lake level, dam condition, breach modelling | Seismic signal, or nothing |
There is one further connection worth holding onto. The 2026 avalanche ran into and re-entrained the deposits left by the 2025 glacial lake outburst flood in the same channel. Saswata Sanyal of ICIMOD put it plainly: "The Lhende Khola has flooded twice in fourteen months." The two events were not analogies for one another. They were physically coupled.
One caveat is worth keeping. Nepal's foreign ministry maintains that the cause is not yet fully and finally determined, and that caution is fair while the field surveys are incomplete. Every specialist assessment published so far points the same way.
The cascade, step by step
What made this event lethal was not the initial collapse. It was what the collapse turned into on the way down.
- Detachment. Bedrock carrying a hanging glacier fails at about 5,200 metres. The source glacier had retreated 450 metres between 1990 and 2020, progressively removing support from the slope beneath it.
- Avalanche. The mass falls roughly 1,200 metres onto the debris-covered glacier below. Friction converts a large part of that energy to heat, and the heat produces meltwater.
- Mobilisation. The flow entrains moraine, ice and, critically, the loose sediment deposited by the 2025 flood. It is no longer an avalanche; it is a debris flow.
- Damming. The flow blocks the Lhende Khola. The impoundment may have held for only minutes.
- Breach. The dam fails and releases as a hyperconcentrated surge. Chinese researchers described "a continuous transition from ice avalanche to debris flow, then to mudslide and finally to flood."
- Propagation and bulking. The surge scours the valley for 22 kilometres, gaining material as it goes, and hits the border settlements as something with the density of wet concrete.
Six process transitions between a rock face and a drowned town. Model any one of them in isolation and it tells you very little about the others.
Cascading, compound and multi-hazard: what the terms actually mean
Three terms get used interchangeably in this field and mean different things.
A cascading event is a chain, where each step causes the next. The Bhote Koshi is a textbook case: the avalanche caused the debris flow, which caused the dam, whose failure caused the flood.
In a compound event, two drivers that each might be tolerable arrive together: a high tide meeting a river in flood, or intense rainfall on a saturated catchment. Neither causes the other. They simply coincide.
A multi-hazard assessment considers several hazards affecting the same receptor, without necessarily linking them.
UK flood risk assessment handles compound events reasonably well. Joint probability analysis for tide and river levels is routine, and the types of flooding framework requires every source to be considered. Cascading events are handled far less consistently, because a chain crosses the boundaries between the things we assess separately. A blocked culvert is a drainage matter, the resulting overtopping is a fluvial matter, and the debris that caused the blockage belongs to nobody's assessment at all.
When a risk register quietly becomes a risk model
Here is the thing that should worry practitioners.
Nepal's monitoring was not negligent. It was well-founded, internationally supported and technically sound. Its failure was categorical: the system could only see hazards of a type someone had already thought to enumerate.
A risk register lists the hazards someone has identified. A risk model represents the hazards that exist. They are not the same object, and the gap between them is invisible from inside the register, because from inside the register everything on the list is being managed and nothing else is showing up.
The signal that the gap has closed is a particular kind of confidence: when "it is not on the map" starts being used as though it meant "it will not happen".
The catalogues UK flood risk runs on
British flood risk practice rests on a set of national datasets, and they are genuinely good ones.
| Dataset | Covers | Does not cover |
|---|---|---|
| Flood Map for Planning (Flood Zones 1, 2, 3a, 3b) | Fluvial and tidal probability, ignoring defences | Surface water, groundwater, sewers, infrastructure failure |
| Risk of Flooding from Surface Water | Pluvial runoff at national scale | Local drainage capacity, blockage, individual assets |
| Reservoir inundation maps | Largest credible uncontrolled release from large raised reservoirs | Smaller structures below the regulatory threshold |
| National Flood Risk Assessment (NaFRA2) | Fluvial, tidal and surface water, with defences and climate change allowances | Anything not in those three sources |
| Historic flood outlines | Where recorded flooding actually reached | Anywhere that has not yet flooded, or flooded unrecorded |
Each of these is a catalogue of a hazard type that somebody defined, mapped and maintains. Each has boundaries that are stated clearly in its own metadata and then quietly forgotten in use. It is worth reading our note on whether flood maps are accurate alongside this, because the honest answer is that they are accurate about the things they map.
The August 2026 revision of the National Planning Policy Framework tightened this considerably. Chapter 18 requires an assessment where there is risk from any source, now or in the future, and Policy F7 is worded so that schemes unable to demonstrate safety over their lifetime should be refused. The policy language has moved from discretionary objection towards refusal. That raises the stakes on getting the source list right.
What sits outside them
The interesting question is what a British site can be harmed by that no national dataset shows.
- Ordinary watercourses, particularly culverted ones. There is no national map of culverts. There is no national map of their condition.
- Trash screens and security screens, whose blockage state is a maintenance matter and appears in no dataset.
- Canals and their embankments. The Whitchurch breach in Shropshire is a useful reminder of what happens when an engineered channel above ground level lets go. We covered it in what the Whitchurch canal breach means for flood risk and planning.
- Small raised reservoirs below the Reservoirs Act threshold, and private ponds, mill leats and attenuation features that no register holds.
- Water mains and sewers. Infrastructure flooding is real, localised and essentially unmapped nationally; it has to be assessed site by site.
None of these is exotic. Every one of them has caused flooding in England in the past decade. What they share is that they are asset-specific, condition-dependent and invisible to a desk study that stops at the national datasets. The catalogue is a starting point for a competent assessment, not a substitute for one, which is the argument we make at greater length in why an expert should write your flood risk assessment.
The clear-water assumption
Now to the technical heart of it.
The single most quoted finding from the Bhote Koshi analysis came from the Chinese research consortium publishing in Chinese Science Bulletin on 2 September. Erosion and entrainment along the 22-kilometre path were, they concluded, "not merely secondary processes" but "crucial factors determining the intensity of the disaster downstream". Their formulation deserves to be read twice:
The actual level of risk depends not only on "how much material collapses" but also on "how much more material can be incorporated along the valley."
Nepal's own preliminary assessment made the same point: the sediment load "substantially increased its destructive effect compared with a clear-water flood."
There is a hard number behind this from the region's own record. In the 2016 Bhotekoshi glacial lake outburst flood, peak discharge was amplified roughly 6.7 times between the lake outlet and the confluence 23 kilometres downstream, from around 618 cubic metres per second to something over 4,100. The lake released between 110,000 and 170,000 cubic metres of water. The flood that arrived downstream was a substantially larger object than the one that left.
British hydraulic models route clear water. That is not a criticism; it is a design decision, and for most purposes it is the right one. But it is worth being clear about how thoroughly it is embedded, and how little guidance exists to counteract it.
The Environment Agency's hydraulic modelling best practice guidance, updated in May 2026, lists "structural blockage" and "siltation or sediment removal scenarios" among recommended model outputs. These are scenarios you construct in addition to the base run, which necessarily contains neither. Sediment transport modules exist in Flood Modeller, TUFLOW and HEC-RAS, and they are not part of a standard flood risk assessment workflow.
More strikingly, there is no published Environment Agency guidance requiring sediment transport assessment in a planning flood risk assessment. It does not appear in the FRA template guidance, the standing advice, or the strategic flood risk assessment guidance. The Agency's own sediment management research from 2011 concedes the reason: sediment movement is "highly unsteady, making sediment loads and deposition rate predictions highly uncertain."
Uncertainty is a fair reason to be cautious about a number. It is a weaker reason to assume zero.
What bulking looks like in a UK catchment
No British river is going to carry a rock-ice avalanche. But the mechanism, a flow acquiring material and becoming more destructive than the water alone would be, is thoroughly familiar here, and it has a name in our practice. We call it blockage.
Boscastle, 16 August 2004 is the case everyone reaches for, and usually for the rainfall. Between 82 and 183 millimetres fell in one to five hours, and peak discharge reached roughly 180 cubic metres per second — around a 0.25% annual probability event. But the modelling tells a more specific story. To reproduce the observed water levels, HR Wallingford found that the main B3263 road bridge "had to be modelled as substantially blocked by flood-borne debris", and that "rapid blockage of the bridge led to rapid increases in water level upstream of the bridge, and a significant re-distribution of flow into the streets". The rainfall filled the valley. The debris chose which streets flooded.
Recent Section 19 investigations say the same thing in less dramatic settings:
- Bloxham, Oxfordshire, November 2024. The investigating authority named "the blockage of a trash screen at an Ordinary Watercourse culvert inlet" as the cause of flooding at one location, with partial blockages reducing conveyance at two others.
- Baguley Brook, Manchester, New Year 2025. The trash screen at a culvert inlet "was blinded with debris and had not been maintained in recent years". Residents got into the brook and cleared it themselves, which "improved the rate of flow into the culvert."
- Debenham, Suffolk, Storm Babet 2023. "There appeared to be a significant level of silt in the culvert which may have influenced its functioning capacity during the event."
- Calderdale, Storm Ciara 2020. A culvert on Stainland Road "was blocked by debris causing water to back up". At Mytholmroyd, the Canal & River Trust recorded that "the large-scale deposition of gravel and sand caused the River Calder to change its course."
That last one is worth pausing on. A British river changed course because of the sediment a flood carried. The mechanism is not foreign. It is only smaller.
So what blockage do you actually model?
This is where English practice has a real gap, and it is worth stating precisely because it is fixable.
The Environment Agency's flood risk assessment template guidance, version 1.0 of March 2025, is clear that the question must be asked. Where a watercourse is culverted or there is a bridge adjacent to the site, it says, "you will need to consider a standard blockage scenario". Under residual risk it repeats the instruction: "If there is a bridge or culverted watercourse nearby, assess the flood risk with different blockage scenarios."
It does not say what a standard blockage scenario is. Neither does the Blockage Management Guide it points you to. No English document publishes a percentage. Not one.
Wales does. Natural Resources Wales guidance note GN43, version 3.0 of September 2020, gives the only published UK table, to be applied where no better information exists:
| Structure | Low | Medium | High |
|---|---|---|---|
| Culverts | 30% | 67% | 100% |
| Bridges | 5% | 25% | 80% |
GN43 also holds the blockage in place for the full duration of the event, and makes blockage assessment mandatory for flood consequence assessments. English practitioners routinely borrow these Welsh numbers, because there is nothing else to borrow. That is not a scandal, but it is an odd position for a policy regime that has just moved to refusal-worded flood policy.
The Environment Agency's own blockage management guide explains why the numbers are thin. Blockage prediction, it says, "is inherently uncertain due to a lack of systematic data gathering", and there is "a significant shortage of blockage data internationally". The best dataset it could assemble ran to 25,265 observations across 140 screens between 2002 and 2008 — collected in Northern Ireland.
And yet debris is already quantified in English practice, in one place: the flood hazard rating. The FD2320 formula is HR = d × (v + 0.5) + DF, where DF is a debris factor. In an urban setting, at depths above 0.25 metres, DF is 1.0 — and since the "danger for most people" threshold sits at a hazard rating of 1.25, the debris factor alone can move a site across it.
So debris is significant enough to be built into the hazard classification that determines whether a site is safe for people, and absent from the modelling guidance that determines the depths and velocities feeding that classification. Both of those positions are defensible on their own. Together they are strange.
Lead time is a design parameter, not a given
The second transferable lesson concerns warning.
Nepal's Department of Hydrology and Meteorology learned about the flood at 08:56, nineteen minutes after the mountain failed, by telephone from someone on the ground. Four automatic gauging stations were destroyed, and every one of them was destroyed reading below its warning threshold. Binod Parajuli, who runs the Flood Forecasting Division, said afterwards: "None of the stations was able to send us an alert." And then: "We failed."
What happened next was better than that admission suggests. Between 09:00 and 09:16, 679,295 SMS warnings went out across the Nepal Telecom and Ncell networks. The message reached people. What varied, enormously, was whether it reached them in time to matter.
What four minutes, fourteen minutes and six hours buy
| Location | Distance from source | Warning available | Outcome |
|---|---|---|---|
| Gyirong Port, China | 22 km | None | Struck seven minutes after the collapse |
| Rasuwagadhi and Timure | ~30 km | 4–10 minutes | Most of the deaths occurred here |
| Bidur, Nuwakot | ~70 km | ~14 minutes | A school principal evacuated 1,643 students |
| Devghat | 168 km | Hours | The warning outran the flood |
Read that table as a curve rather than a list. The value of a warning system does not decline smoothly with proximity to the source; it collapses. At the border it bought nothing. Seventy kilometres downstream, one phone call and fourteen minutes moved sixteen hundred children out of the way.
British practice has the same curve, and we are not always explicit about where a given site sits on it. The Environment Agency's published lead times are: a flood alert between 2 and 12 hours ahead, and a flood warning between 30 minutes and 2 hours ahead. Note which way that range runs. The two hours people cite as the standard is the ceiling, not the floor.
Three further points follow from the published position, and each of them matters when a flood warning and evacuation plan is being written.
There is no property-level surface water warning service in England. The warning products cover rivers, the sea, and heavy rain that will make rivers flash flood. For roughly 3.4 million properties at surface water risk, no equivalent warning exists. The Surface Water Flooding Forecasting Improvement Project, whose results were published in April 2026, was aimed squarely at the missing zero-to-six-hour nowcasting window, and it delivered the Rapid Flood Guidance service, which is for professional responders, gives no information on specific rivers or local features, and is not issued to the public. Recent academic work puts a hard ceiling on the ambition, with one 2026 paper titled around a three-hour predictability limit for surface water nowcasting.
In rapid response catchments, warning time can be zero. The Environment Agency's own position, repeated by the local authorities that host these catchments, is that "flooding can occur before flood warnings are issued". The Agency's approach in them is preparedness-led rather than warning-led, for the good reason that warning is not reliably available.
No English guidance states a minimum lead time an emergency plan must assume. Standing advice requires that a development can be evacuated before an extreme event; the FRA template guidance asks you to assess whether a warning provides "sufficient forewarning"; the ADEPT and Environment Agency guidance on flood risk emergency plans asks you to "estimate the likely lead-time available". None of them puts a number on it.
That is defensible; it should be a site-specific judgement. But it means the judgement is genuinely yours, and a plan built on an unstated assumption of two hours is resting on the optimistic end of a published range that bottoms out at thirty minutes and, in fast catchments, at nothing. Setting that assumption deliberately, and writing down the evidence for it, is the substance of a flood warning and evacuation plan that will survive scrutiny. Our explainers on who actually issues flood warnings and on the Flood Forecasting Centre set out where the forecast behind that warning comes from.
Rebuilding into the same footprint
The third lesson is the least technical and the most uncomfortable.
The Miteri Bridge at Rasuwagadhi, which the 2026 flood destroyed, had only just been rebuilt. Its predecessor was carried away by the July 2025 flood in the same valley, and the border crossing had reopened at the start of 2026 after roughly six months closed. The Timure dry port, a three-billion-rupee project with two billion already spent, was destroyed, having already been damaged in 2025 and with no additional protection added in the interval. The road was repaired within a month of the 2025 flood and destroyed again in 2026.
Ashish Gajurel, who chairs the Nepali parliament's development committee, said what everyone was thinking: "Last year's flood had already given a strong warning to the customs point and the surrounding settlements. Perhaps we failed to take it seriously."
Before that reads as criticism of a country in the middle of a catastrophe, it is worth noticing how familiar the behaviour is. England rebuilds in floodplains constantly, and does it with more paperwork and better intentions but broadly the same result. The whole architecture of the sequential and exception tests exists to force the question that Nepal did not get to ask: is there somewhere else this could go?
The tests are not popular, and the criticism that they slow delivery is not unreasonable. But their function is precisely to interrupt the default, which everywhere in the world is to put the thing back where it was, because that is where the road goes and where the land is already owned. Our guides to the sequential and exception tests and to rebuilding a house in a flood zone set out how that plays out in practice.
The precursors nobody was reading
One last finding, and it is the one that will age worst for Nepal.
The HiRISK rapid assessment identified visible warning signs in satellite imagery in the days before the collapse: a change in the glacier surface, evidence of accelerating internal water movement, meltwater running visibly brown by 24 August, and a crack propagating into the bedrock slope. Separately, Manoochehr Shirzaei at Virginia Tech analysed Sentinel-1 radar covering January to August 2026 and found the slope creeping at around ten millimetres a month and accelerating in the days before failure. His observation is the sharp one: "The acceleration is more important than the velocity, because it suggests that the rate of slope deformation was changing in the days leading up to the disaster."
The data existed. Satellites were already collecting it, and would have gone on collecting it whether anyone looked or not. Nobody looked at that slope, because that slope was not on the list.
The British equivalent is not glacier creep. It is asset condition. The Environment Agency's own corporate reporting has flagged high-consequence asset condition as underperforming, and the Environmental Audit Committee found condition falling from 98% in 2018-19 to 93% by 2024. Culvert and screen condition, on ordinary watercourses, is recorded even less consistently. The question the Nepal event poses to any monitoring regime is a simple one: what is already in your data that nobody is reading?
What transfers to UK practice, and what doesn't
Being honest about the limits is what keeps this from being a stretched analogy.
What does not transfer. The hazard itself, obviously. Also the scale: nothing in British flood risk involves a 1,200-metre drop, a magnitude 5.2 seismic signature or a flow front at 190 kilometres per hour. Nor does the governance failure. England has a defined lead local flood authority for every ordinary watercourse, a statutory flood risk management framework, and nothing resembling the cross-border data impasse between Nepal and China. And the climate attribution does not transfer either: every scientist quoted on the Nepal event declined to attribute this particular collapse to climate change, and anyone reaching for it as a UK argument should note that the region's own institute said the same.
What does transfer, and is worth acting on:
- Interrogate the source list, not just the map. A competent assessment starts with the national datasets and then asks what could harm this site that no dataset shows: the culvert, the screen, the canal, the private pond, the main.
- Model the blockage, and record the number you chose. English guidance requires a blockage scenario and defines none. Choosing 30%, 67% or 100% and writing down why is better practice than leaving the base run to speak for itself.
- State the lead-time assumption explicitly. Do not let "there will be a flood warning" stand in for an evidenced estimate of how long the occupants have.
- Treat a second event in the same place as information. The strongest predictor of where a flood will happen is where one happened before, and the strongest institutional temptation is to treat each one as unprecedented.
- Ask what your own monitoring is not looking at. The precursors were in the data. The gap was in attention.
None of that is a novel methodology. It is ordinary diligence, applied to the part of the problem that sits outside the catalogue, which is exactly the part where a register quietly becomes a model.
More than a thousand people died on the Bhote Koshi because a hazard nobody had enumerated behaved in a way nobody had modelled, in a valley that had flooded fourteen months earlier. The scale of that is not transferable and should not be trivialised by pretending otherwise. The reasoning behind it is entirely transferable, and it is available to anyone willing to look past the edge of the map.
If you need that thinking applied to a site, talk to us about a flood risk assessment.
Frequently asked questions
Can a glacial lake outburst flood happen in the UK?
No. Britain has no glaciers, so there are no glacially dammed or moraine-dammed lakes to fail. The closest structural analogues are impounded water held behind something that was not built to hold it indefinitely: canal embankments, small raised reservoirs below the Reservoirs Act threshold, disused mill ponds, mine water, and old tailings or lagoon structures. None carries the energy of a Himalayan event, and all of them share the defining feature: a body of water above the ground it would run onto, held by a structure whose condition is not systematically recorded.
Who is responsible for maintaining a culvert or trash screen in England?
Usually the riparian owner, meaning whoever owns the land the watercourse runs through or alongside, with obligations under the Land Drainage Act 1991. On a main river the Environment Agency has permissive powers but not a duty to maintain; on an ordinary watercourse the lead local flood authority regulates but does not generally maintain. In practice a screen can sit on private land, protect a public highway and be cleared by nobody in particular. Our guide to riparian ownership sets out where the duties fall, and ordinary watercourse consent covers what you need before altering one.
How do I find out whether a site is in a rapid response catchment?
Rapid response catchments are classified by the Environment Agency and are not published as a single national public map layer. The practical routes are the local authority's multi-agency flood plan, the Level 1 or Level 2 strategic flood risk assessment for the area, and a direct enquiry to the lead local flood authority or the Environment Agency. Steep catchments, small urbanised catchments and short watercourses with impermeable geology are the usual candidates. If a site sits in one, the warning assumption in any emergency plan should be treated as close to zero.
Was the flood caused by climate change?
No individual event attribution has been published, and the scientists closest to it were careful to say so. What is documented is the background: terrain above 4,000 metres in the Langtang catchment has warmed at roughly five times the global average rate, the catchment has lost around 42% of its glacier area since the early nineteenth century, and the source glacier itself retreated 450 metres between 1990 and 2020, progressively removing support from the bedrock beneath. Warming raises the probability of this class of failure. Whether it caused this particular one on this particular morning is a question nobody has yet answered, and the region's own research institute has said it is premature to claim otherwise.
About the author. Edward is a co-founder and Director of Unda with 20+ years in flood risk and drainage, and a national-press commentator on flooding. Unda has been trading since 2014, is a CIWEM Business Partner with CIWEM member and chartered (C.WEM MCIWEM) consultants, and has delivered 5,000+ flood risk assessments and drainage strategies across England and Wales.
Edward Bouët · BSc (Hons)
Latest news
One of our experienced Flood Risk Consultants will get back to you within 60 minutes
